Dataroma Stock Screener: 13F Analysis vs Public Institutional Radar
Dataroma Stock Screener: 13F Analysis vs Public Institutional Radar
Retail equity research often begins with tools that aggregate hedge fund holdings, with the dataroma stock screener standing as one of the most recognized free platforms for tracking high-conviction portfolios. To evaluate how institutional ownership metrics translate into actionable market intelligence, professional analysts utilize the superinvestors portfolio intelligence hub to audit raw regulatory disclosures against proprietary screening heuristics.
Every quarter, over 70 top-tier asset managers—including Warren Buffett, Mohnish Pabrai, Guy Spier, and Li Lu—submit statutory ownership filings under Section 13(f) of the Securities Exchange Act of 1934. The dataroma stock screener extracts these filings, organizing them into consensus buy lists, ownership percentage rankings, and portfolio weight metrics. While this provides a clean snapshot of value-oriented institutional capital, relying on screening algorithms without understanding data aggregation methodology introduces structural blind spots that can distort investment decisions.
1. Methodology: How the Dataroma Stock Screener Aggregates Filings
The core utility of the dataroma stock screener lies in its multi-manager cross-referencing engine. Instead of requiring users to parse hundreds of individual SEC accession numbers, the interface compiles long-only equity positions into unified ticker summaries. When multiple managers initiate or expand positions in a specific equity during the same reporting period, the screener flags the company on its consensus dashboard.
The screener tracks three primary metrics across its manager universe: consensus ownership count (how many managers hold the security), average portfolio allocation (percentage of reportable assets dedicated to the position), and net quarter-over-quarter share accumulation. For example, when Berkshire Hathaway, Duquesne Family Office, and Scion Asset Management simultaneously hold an equity, the security ranks among the top decile of institutional consensus. However, the platform treats all 74 managers with equal qualitative weight, regardless of whether a fund manages $200 million or $300 billion in discretionary assets.
2. Consensus Ownership Patterns Across Major Equities
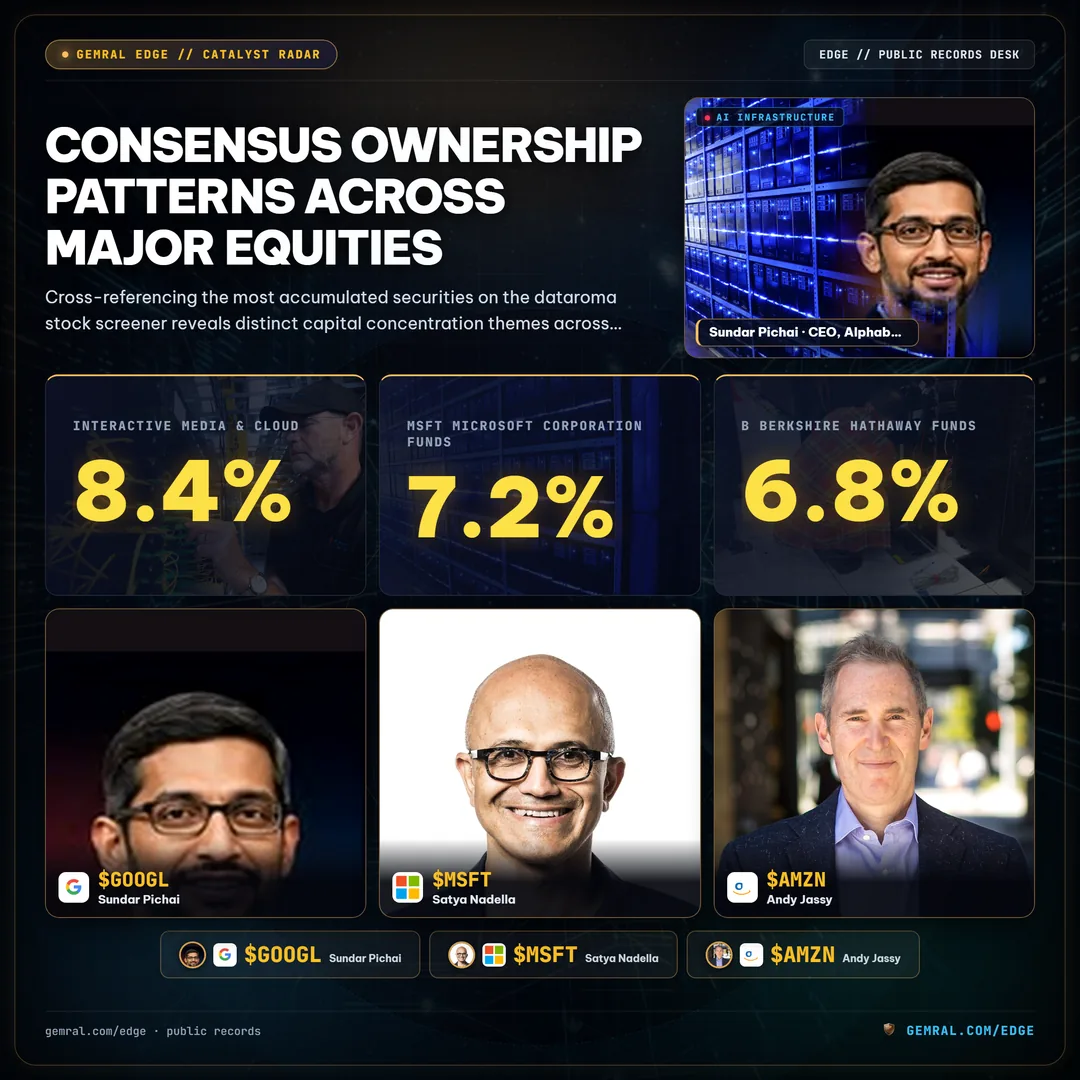
Cross-referencing the most accumulated securities on the dataroma stock screener reveals distinct capital concentration themes across modern enterprise technology, banking, and media holdings. Below is an audit of the top consensus equities held across elite fund managers in recent quarterly disclosure windows:
| Ticker | Company Name | Holding Funds | Avg Portfolio Weight | Primary Sector |
|---|---|---|---|---|
| GOOGL | Alphabet Inc. | 41 Funds | 8.4% | Interactive Media & Cloud |
| MSFT | Microsoft Corporation | 38 Funds | 7.2% | Enterprise Infrastructure |
| BRK.B | Berkshire Hathaway | 29 Funds | 6.8% | Diversified Financials |
| AMZN | Amazon.com Inc. | 34 Funds | 5.9% | E-Commerce & AWS Compute |
| BAC | Bank of America Corp | 22 Funds | 4.5% | Commercial Banking |
While mega-cap consensus reflects durable corporate moats and strong cash-flow generation, it also introduces significant correlation risk. When top hedge funds and family offices crowd into identical positions, any macro liquidity contraction or sector-wide derisking triggers simultaneous selling pressure across multiple funds, creating sharp price dislocations that fundamental screening models fail to anticipate.
3. Critical Limitations of Free Stock Screeners
While the dataroma stock screener provides exceptional clarity on historical filings, investors must account for four inherent structural limitations embedded within public 13F aggregation tools:

- Statutory Reporting Latency: Form 13F filings are due 45 days after quarter-end. By the time a stock appears on a consensus screener, the underlying purchases occurred between 45 and 135 days prior. Rapid position adjustments or tactical hedges are invisible during this multi-month lag.
- Absence of Short Positions and Derivatives: Under current SEC reporting thresholds, short positions, options overlays, and swap agreements are not reportable on Form 13F. A fund that appears aggressively long a stock may actually hold paired short hedges or put options that neutralize directional exposure.
- Exclusion of Foreign-Listed Securities: Institutional holdings listed on international exchanges (such as Tokyo, London, Frankfurt, or Hong Kong) are exempt from 13F mandates. This creates an artificial home-bias toward US-listed equities in screening results.
- Equal-Weight Aggregation Bias: Aggregation algorithms frequently treat a $5 million starter position from a small fund with the same conviction signal as a $4 billion high-conviction bet from a major endowment or sovereign allocator.
Because of these limitations, using a stock screener as a standalone cloning mechanism often results in buying equities after institutional momentum has already peaked.
4. Quantitative Best Practices for Institutional 13F Tracking
To extract genuine informational value from the dataroma stock screener without falling victim to latency traps, professional researchers combine quarterly snapshots with higher-frequency public records. The most effective quantitative framework incorporates three verification layers:
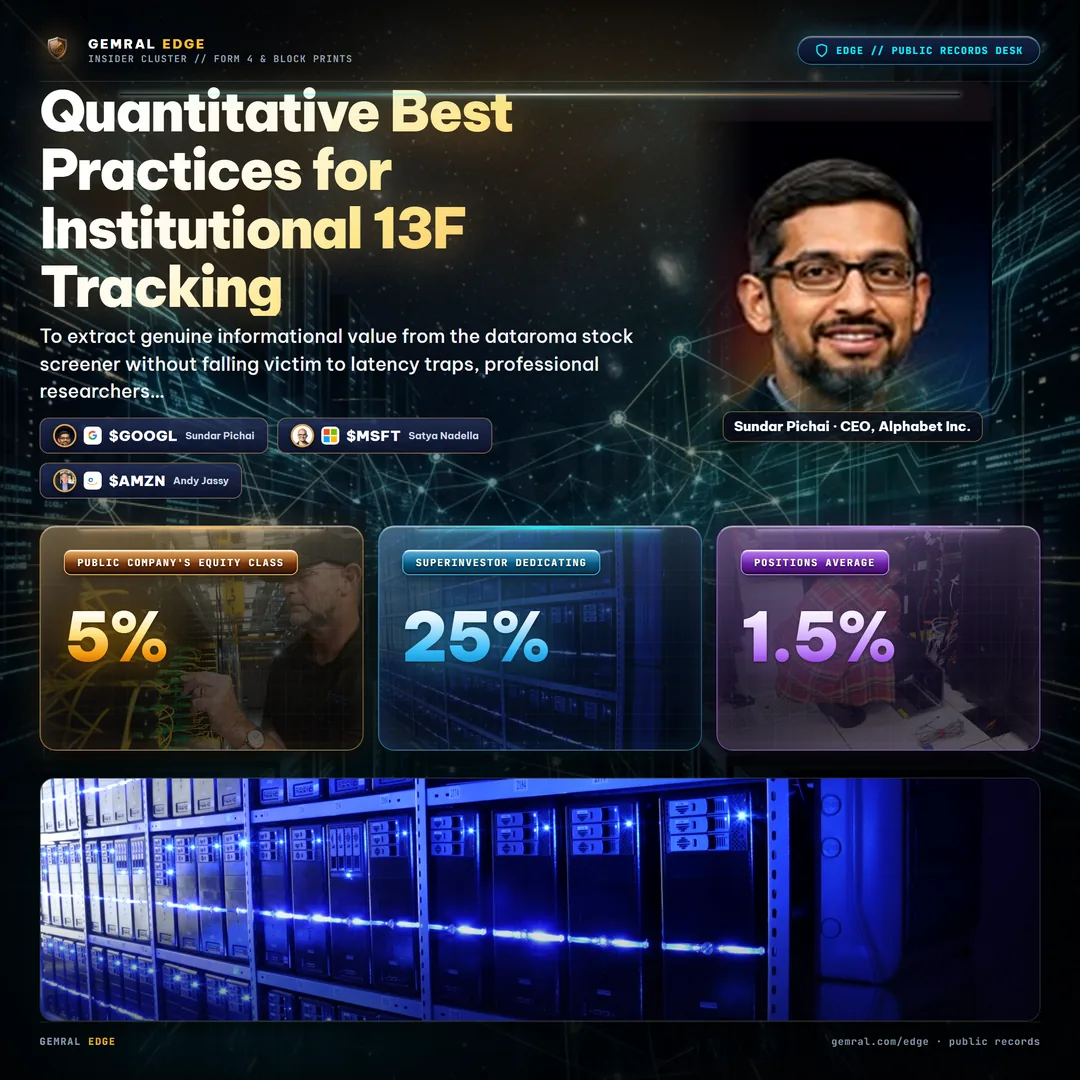
First, cross-examine 13F consensus alerts against Form 13D and Form 13G beneficial ownership disclosures. Unlike quarterly 13F filings, Schedule 13D filings require disclosure within 5 business days whenever an investor acquires beneficial ownership of more than 5% of a public company's equity class, providing timely confirmation of activist or strategic stakes.
Second, track Form 4 insider transaction filings. When corporate officers and board directors execute open-market purchases in the same ticker that superinvestors are accumulating, the convergence of internal insider conviction and external institutional sponsorship provides a substantially higher statistical signal than 13F filings alone.
Third, analyze portfolio concentration rather than raw ticker counts. A superinvestor dedicating 25% of their capital to a single contrarian position represents a far more powerful thesis than a fund holding 60 positions with an average 1.5% weighting across standard index components.
Regulatory & Investment Disclaimer: Public data · not investment advice. All portfolio holdings, manager allocations, and regulatory filing intervals are derived exclusively from public disclosure records submitted to the U.S. Securities and Exchange Commission (SEC). Past performance and institutional ownership consensus do not guarantee future investment returns.