Dataroma 13F Filings Tracker Explained: SEC Form Data and Portfolio Shifts

Dataroma 13F Filings Tracker Explained: SEC Form Data and Portfolio Shifts
Understanding how major asset managers position billions in discretionary capital begins with regulatory filings, and the dataroma 13f tracking architecture has become a primary reference for monitoring quarterly institutional disclosures. To evaluate how raw SEC filings are parsed, mapped, and audited across reporting cycles, professional market participants turn to the superinvestor tracking terminal to dissect filings with complete statutory provenance.
Every quarter, institutional managers controlling more than $100 million in qualifying US equity securities must submit Form 13F filings to the Securities and Exchange Commission. Platforms like Dataroma normalize these complex XML data feeds into readable portfolio tables, tracking changes in share counts, portfolio percentages, and position additions or reductions. However, successfully interpreting a dataroma 13f filing summary requires knowing exactly what regulatory rules govern these submissions and where data normalization can obscure critical trading nuance.
1. The Statutory Framework: Section 13(f) Filing Rules
Form 13F was established by the US Congress in 1975 under Section 13(f) of the Securities Exchange Act. The explicit statutory objective was to create public transparency regarding institutional holdings of US equities, allowing market observers to evaluate capital concentration and systemic market stability.

Under SEC Rule 13f-1, an institutional investment manager exercising investment discretion over $100 million or more in Section 13(f) securities must submit Form 13F electronically within 45 calendar days after the end of each calendar quarter. The SEC publishes an official list of Section 13(f) securities quarterly, encompassing approximately 20,000 equity securities, including common stock, exchange-traded funds (ETFs), closed-end funds, certain convertible debt instruments, and equity options (calls and puts). Fixed income securities, open-end mutual funds, and non-US listed equities are excluded.
2. How Dataroma Normalizes 13F Data Feeds
When an institutional filer submits Form 13F to the SEC EDGAR system, the submission consists of an Information Table XML file containing CUSIP numbers, issuer names, class titles, market values, and share amounts. The dataroma 13f tracker parses this raw feed through several processing stages to produce investor-friendly dashboards:
| Raw SEC 13F Field | Dataroma Normalization | Analytical Significance |
|---|---|---|
| CUSIP / Issuer Name | Ticker Symbol Mapping | Converts nine-character CUSIP codes into active exchange tickers (e.g., AAPL, GOOGL) |
| Value ($ thousands) | Portfolio Percentage Calculation | Divides position value by total reported 13F assets to derive portfolio weight |
| Shares Held | Quarter-over-Quarter Share Delta | Calculates net change in shares to identify new buys, adds, reduces, or complete exits |
| Filing Date | Activity Timeline Indexing | Timestamps reporting submission relative to the 45-day statutory window |
| Investment Discretion | Manager Consolidation | Aggregates sole, shared, and defined discretionary authority across multi-entity funds |
Through this mapping process, the dataroma 13f platform allows users to view a superinvestor's portfolio as an evolving entity, comparing allocation shifts across quarters. Analysts can immediately determine whether Warren Buffett increased Berkshire Hathaway's cash allocation, whether Michael Burry re-entered semiconductor equities, or whether Stanley Druckenmiller expanded his enterprise AI exposure.
3. Common Pitfalls When Interpreting 13F Filings
While the dataroma 13f interface provides significant clarity, relying solely on 13F data without context can mislead investors. The four most critical structural pitfalls include:

- The 45-Day Information Latency: Because managers have 45 days after quarter-end to submit filings, the data represents a historical snapshot that is 45 to 135 days old. A fund could have accumulated a position in January and completely sold it in April before the filing becomes public on May 15.
- Omission of Short Exposure and Swaps: Form 13F only requires disclosure of long equity positions and certain options. Total return swaps, contracts-for-difference (CFDs), and physical short sales are completely excluded. A manager showing a large long equity position may actually be market-neutral or net-short via off-balance-sheet derivatives.
- Artificial Share Price Calculations: Dataroma estimates purchase prices by averaging the high and low trading prices of the stock during the preceding quarter. In volatile equities, the actual execution price paid by the manager may differ substantially from the estimated cost basis.
- Confidential Treatment Requests: Under Section 13(f)(4), managers may request confidential treatment from the SEC for ongoing accumulation or disposition programs. This allows institutions to delay disclosing high-conviction positions until accumulation is complete, hiding the earliest phases of a thesis.
4. Advanced 13F Synthesis: Beyond Single-Manager Cloning
Professional quantitative investors do not use the dataroma 13f filings tracker to copy individual trades blindly. Instead, they use normalized 13F data as a secondary filter within a broader multi-source research workflow.
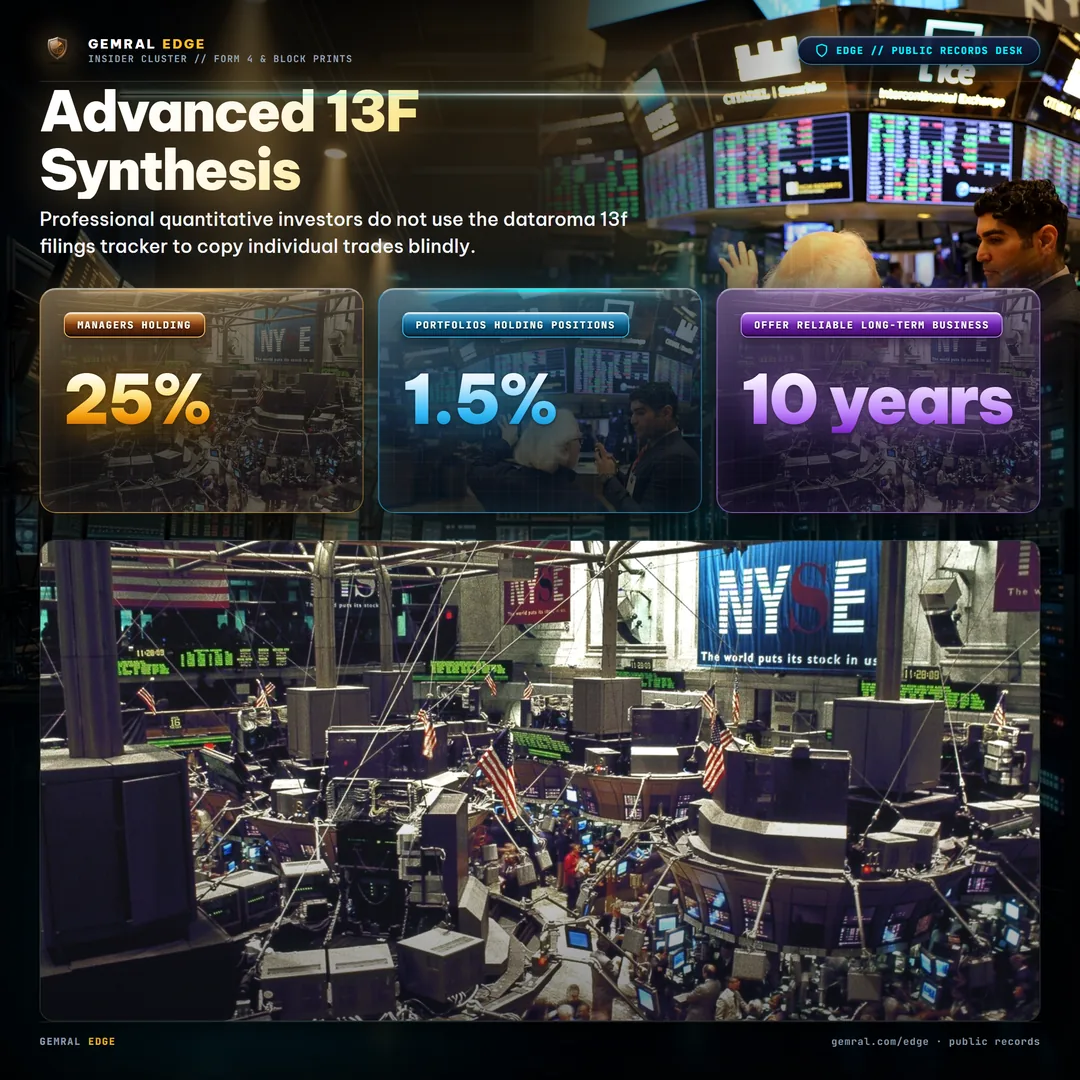
One primary strategy is multi-manager consensus clustering. When three or more independent value-oriented managers—who typically exhibit low portfolio correlation—simultaneously initiate positions in an unloved or beaten-down sector, the probability of an underlying fundamental catalyst or valuation floor increases substantially. Allocators look for managers holding 25% or more in top ideas rather than diversified portfolios holding 60 positions at 1.5% each.
A second technique is cross-referencing 13F holdings with Form 4 insider transactions. When institutional accumulation coincides with open-market buying by corporate executives and board directors, the alignment of internal corporate insiders and external institutional allocators provides a statistically robust conviction signal.
Finally, tracking portfolio turnover rates reveals manager temperament. Low-turnover managers holding positions for 5 to 10 years offer reliable long-term business evaluation frameworks, whereas high-turnover macro funds require real-time positioning updates that quarterly 13F filings cannot provide.
Regulatory & Investment Disclaimer: Public data · not investment advice. All filing metrics, manager portfolios, and regulatory references are sourced directly from public disclosures filed with the U.S. Securities and Exchange Commission (SEC). Past performance of institutional managers does not predict future market outcomes.