CPI vs PCE Inflation: Why the Fed Prefers PCE and What Drives the Gap
A rigorous quantitative breakdown comparing the Consumer Price Index (CPI) and Personal Consumption Expenditures (PCE) price index, analyzing mathematical formula architecture, housing shelter vs healthcare weighting disparities, and Federal Reserve policy targeting.

In macroeconomic modeling and sovereign rate curve positioning, the divergence between cpi vs pce inflation represents one of the most critical structural differentials in global financial markets. While retail financial commentators often treat inflation as a single monolithic metric, institutional allocation desks, interest rate swap traders, and monetary policy committees maintain strict mathematical distinction between these two primary statistical series. The Consumer Price Index (CPI), published monthly by the Bureau of Labor Statistics (BLS), captures out-of-pocket expenses incurred directly by urban households. In contrast, the Personal Consumption Expenditures (PCE) price index, compiled by the Bureau of Economic Analysis (BEA) as part of the National Income and Product Accounts (NIPA), measures comprehensive expenditure across the entire domestic economy.
Understanding the structural mechanics of cpi vs pce is paramount as institutional allocators prepare for high-impact policy events, such as the upcoming Federal Open Market Committee (FOMC) interest rate decision and the November 2026 CPI Release Date & Forecast Catalyst scheduled for December 10, 2026 at 8:30 a.m. ET. Because the Federal Reserve officially targets the Core PCE price index rather than CPI for setting the federal funds rate target corridor, misinterpreting the spread between these benchmarks leads to erroneous positioning in Treasury duration, TIPS breakevens, and corporate credit risk premiums.
Historically, Headline CPI runs approximately 30 to 50 basis points higher than Headline PCE on an annualized basis. During periods of sharp macroeconomic transition, however, this spread can expand dramatically. In the 2022 to 2024 inflationary cycle, the wedge between year-over-year Core CPI and Core PCE widened beyond 150 basis points, driven by rapid shelter price inflation and divergent methodology in healthcare service pricing. This report delivers an exhaustive quantitative examination of the formulaic, weighting, scope, and empirical properties that govern cpi vs pce inflation.
Understanding CPI vs PCE: Core Definitions and Structural Methodologies
To establish institutional clarity, quantitative allocators must evaluate the differing statistical mandates, publishing agencies, and survey mechanisms governing both indices. The fundamental divergence between cpi vs pce begins with the economic objective of each metric. The Consumer Price Index is designed as a conditional cost-of-goods index (COGI) reflecting the out-of-pocket costs required to maintain a fixed standard of living for urban consumers. The PCE price index is formulated as a comprehensive deflator of aggregate household consumption, capturing total economic activity regardless of who finances the purchase.

The statistical compilation processes reflect these differing institutional designs across five structural dimensions:
- Publishing Authority: CPI is calculated and released by the Bureau of Labor Statistics (BLS), a branch of the U.S. Department of Labor. PCE is computed and published by the Bureau of Economic Analysis (BEA), an agency of the U.S. Department of Commerce.
- Primary Data Collection Framework: The BLS collects CPI data through two extensive field operations: the Consumer Expenditure (CE) Survey (interviewing approximately 24,000 households annually to derive consumption weights) and the Point-of-Purchase Survey, which samples approximately 94,000 prices across 23,000 retail and service establishments every month. The BEA, by contrast, relies primarily on business-side revenue data, drawing heavily from the Census Bureau's Service Annual Survey (SAS), Quarterly Services Survey (QSS), and Monthly Retail Trade Survey, supplemented by administrative data from regulatory bodies.
- Target Population Scope: CPI-U (All Urban Consumers) covers approximately 93 percent of the total U.S. population, deliberately omitting rural populations, military personnel on active duty, and institutionalized individuals. PCE covers 100 percent of the U.S. resident population, including rural households, foreign travelers spending domestically, and non-profit institutions serving households (NPISH).
- Financing and Payment Boundary: CPI records exclusively what consumers pay out of their own pockets. If an expenditure is covered by an employer, private insurance provider, or federal agency, CPI ignores it entirely. PCE records all consumption, incorporating third-party healthcare reimbursements, government Medicaid and Medicare transfers, and subsidized social services.
- Revision Frequency: CPI is rarely revised historically; once a monthly headline print is published, the non-seasonally adjusted index values remain permanently fixed, only undergoing periodic seasonal adjustment recalculations once per year. PCE is revised extensively on a monthly, annual, and comprehensive five-year benchmark cycle as updated gross domestic product and tax data become available.
Because financial derivative contracts—such as Treasury Inflation-Protected Securities (TIPS) and CPI-linked interest rate swaps—settle against non-revised monthly index levels, financial markets rely on CPI for cash flow indexation. Conversely, macroeconomic research departments, central bank economists, and academic forecasting desks rely on PCE because its revised time series provides an economically pure historical deflator of consumer activity.
Formula Architecture: Laspeyres vs Fisher-Ideal Index Mechanics
The primary mathematical driver of the persistent spread between cpi vs pce is the index calculation formula. Price index compilers must confront the substitution effect: when the relative price of a specific good or service increases, rational consumers reduce their consumption of that item and substitute relatively cheaper alternatives. How an index accounts for this dynamic dictates whether it introduces upward substitution bias.

The Consumer Price Index employs a modified Laspeyres formula at its upper aggregation level. Mathematically, a classic Laspeyres price index ($P_L$) is defined as:
P_L = \frac{\sum (P_{t,i} \times Q_{0,i})}{\sum (P_{0,i} \times Q_{0,i})}
Where $P_{t,i}$ represents the price of item $i$ in current period $t$, $P_{0,i}$ represents the price of item $i$ in base period $0$, and $Q_{0,i}$ represents the fixed quantity consumed during base period $0$.
Because the Laspeyres formula holds consumption quantities ($Q_0$) fixed over time, it assumes that consumers continue purchasing the exact same volume of goods even when prices surge. If beef prices double while poultry prices remain flat, the fixed-basket Laspeyres formula assumes the consumer buys the identical tonnage of beef, overstating the true increase in the cost of living. In 1996, the landmark Boskin Commission estimated that substitution bias alone inflated annual CPI readings by approximately 0.40 percentage points per year. While the BLS introduced geometric weighting at the elementary item level in 1999 and transitioned to annual basket updates in 2023, CPI remains fundamentally an upper-level modified Laspeyres index.
In stark contrast, the Personal Consumption Expenditures price index utilizes a chained Fisher-Ideal formula, which represents the geometric mean of a Laspeyres index ($P_L$) and a Paasche index ($P_P$). The Paasche index calculates current-period prices weighted by current-period consumption quantities ($Q_t$):
P_F = \sqrt{P_L \times P_P} = \sqrt{ \left( \frac{\sum P_{t,i} Q_{0,i}}{\sum P_{0,i} Q_{0,i}} \right) \times \left( \frac{\sum P_{t,i} Q_{t,i}}{\sum P_{0,i} Q_{t,i}} \right) }
The Fisher-Ideal formula is classified in economic theory as a superlative index because it provides a second-order approximation to an arbitrary expenditure function, fully capturing both income and substitution effects as they occur in real time.
The BEA updates the quantity weights ($Q_t$) in the PCE index every single month as real-time sales and revenue reports are integrated. If domestic consumers switch from ground beef to chicken, PCE's monthly expenditure weights immediately reflect lower beef consumption and higher chicken purchases. Consequently, PCE eliminates upper-level substitution bias. Econometric decomposition studies conducted by the Federal Reserve Bank of San Francisco indicate that the formula effect alone accounts for an average of 15 to 20 basis points (0.15% to 0.20%) of the annual CPI premium over PCE.
Basket Weighting Divergence: Shelter Dominance vs Healthcare Allocation
While the mathematical formula accounts for a baseline wedge, the largest source of cyclical divergence between cpi vs pce is the radical disparity in basket weights. The relative importance of major spending categories differs substantially between the two indices due to their underlying expenditure definitions.

| Expenditure Category | Headline CPI Weight (%) | Headline PCE Weight (%) | Relative Weight Delta (CPI - PCE) | Core Analytical Driver |
|---|---|---|---|---|
| Housing Shelter | 36.2% | 15.5% | +20.7% | CPI counts only consumer rental cash flows; PCE includes full economy consumption base |
| Owners' Equivalent Rent (OER) | 26.8% | 11.4% | +15.4% | Imputed rental value of owner-occupied primary residences |
| Medical Care & Healthcare | 8.5% | 17.4% | -8.9% | CPI measures out-of-pocket patient co-pays; PCE includes employer insurance and Medicare |
| Transportation & Motor Vehicles | 16.8% | 10.2% | +6.6% | Higher vehicle ownership weight in urban household expenditure surveys |
| Food and Beverages | 13.4% | 7.8% | +5.6% | Household grocery spending represents a larger share of urban out-of-pocket outlays |
| Energy Commodities & Services | 6.7% | 3.9% | +2.8% | Direct retail gasoline and home utility weighting is concentrated in household budgets |
| Recreation & Personal Services | 5.4% | 11.6% | -6.2% | Broader commercial entertainment, gaming, and non-profit services in PCE |
| Education & Communication | 5.8% | 5.6% | +0.2% | Roughly equivalent, though PCE includes non-profit institutional educational endowments |
| Other Goods & Services | 7.2% | 28.0% | -20.8% | PCE incorporates imputed financial services, life insurance, and corporate legal services |
The single most dominant structural divergence is found in the housing shelter sector. Within Headline CPI, total shelter commands a measured 36.2 percent weighting. When food and energy are stripped away to compute Core CPI, the shelter weighting surges to approximately 44.5 percent. Within Headline PCE, however, shelter accounts for only 15.5 percent (and approximately 18.2 percent of Core PCE).
This structural gap arises because PCE's total spending denominator ($PCE_{Total}$) includes hundreds of billions of dollars in employer-paid benefits, corporate business travel, and non-profit operations that do not exist in the household-level CPI denominator ($CPI_{Total}$). Because the PCE denominator is roughly 30 percent larger in dollar terms, the mathematical share occupied by residential rent and Owners' Equivalent Rent (OER) is mechanically diluted by more than half.
Conversely, healthcare represents the second major axis of divergence. Within CPI, medical care commodities and services constitute only 8.5 percent of the total basket. CPI surveys households directly, capturing only the actual checks written by patients for prescription co-pays, dental visits, and health insurance premiums. In contrast, healthcare represents 17.4 percent of the PCE basket—more than double the CPI allocation. PCE captures the full economic cost of American healthcare delivery, including $1.5 trillion in annual employer-sponsored healthcare contributions, as well as federal outlays across Medicare, Medicaid, and the Veterans Health Administration. When medical service costs rise, PCE absorbs a far larger inflationary shock than CPI.
Data Scope and Coverage: Consumer Surveys vs Third-Party Business Records
Beyond mathematical formulas and basket weights, the third foundational pillar separating cpi vs pce is the scope and underlying source data used to track individual price movements. Even when measuring the exact same economic sub-category, the BLS and BEA frequently ingest price data from fundamentally different institutional gates.

The divergence in healthcare pricing provides the most striking real-world demonstration of this phenomenon. When calculating the Medical Care index in CPI, the BLS collects price quotes from retail pharmacies, clinics, and health insurance providers for consumer out-of-pocket transactions. However, because health insurance policies frequently change coverage tiers, deductibles, and co-payment schedules, measuring consumer healthcare prices directly is notoriously difficult. The BLS historically relied on a retained earnings approach to estimate health insurance inflation, which introduced artificial volatility and multi-month lags into CPI medical care indices.
The Bureau of Economic Analysis avoids this survey problem by drawing its PCE healthcare price telemetry directly from the Producer Price Index (PPI) and administrative billing data from the Centers for Medicare & Medicaid Services (CMS). Specifically, PCE healthcare inputs are mapped directly to:
- PPI Hospital Services: Measures the net reimbursement prices received by general medical and surgical hospitals from public and private insurers.
- PPI Offices of Physicians: Measures actual commercial reimbursement schedules paid to healthcare practices, rather than retail patient sticker prices.
- PPI Nursing and Residential Care Facilities: Tracks enterprise institutional care fees directly from facility accounting systems.
- CMS Administrative Billing Records: Ingests statutory Medicaid and Medicare payment rate adjustments published directly in federal regulatory registers.
Because PCE incorporates wholesale producer prices from PPI rather than retail consumer surveys, the trajectory of healthcare inflation in PCE frequently decouples from CPI. When state governments freeze Medicaid reimbursement schedules or Congress enacts statutory Medicare pricing caps, PCE healthcare inflation decelerates immediately, even if commercial retail health insurance premiums in CPI continue rising by 8 to 12 percent annually.
Similarly, PCE incorporates imputed financial services that have zero representation in CPI. In modern banking, consumers frequently receive free checking accounts, credit card reward points, and investment platform access without paying direct cash commissions. In exchange, commercial banks capture net interest margin on deposits. The BEA imputes the value of these services (termed "financial services furnished without payment") and includes them in PCE with an approximate 2.5 percent weighting. During periods of sharp Federal Reserve monetary policy shifts, changes in bank deposit spreads create synthetic inflation or deflation within the PCE index that is entirely absent from the CPI.
Monetary Policy Anchor: Why the Federal Reserve Targets Core PCE Over CPI
A frequent point of confusion among market participants is why the Federal Reserve chose Core PCE as its official statutory inflation target rather than the more widely publicized Consumer Price Index. The Federal Reserve's mandate under the Humphrey-Hawkins Full Employment Act requires the central bank to pursue maximum employment and stable prices. However, the legislation does not specify which price index must define price stability.
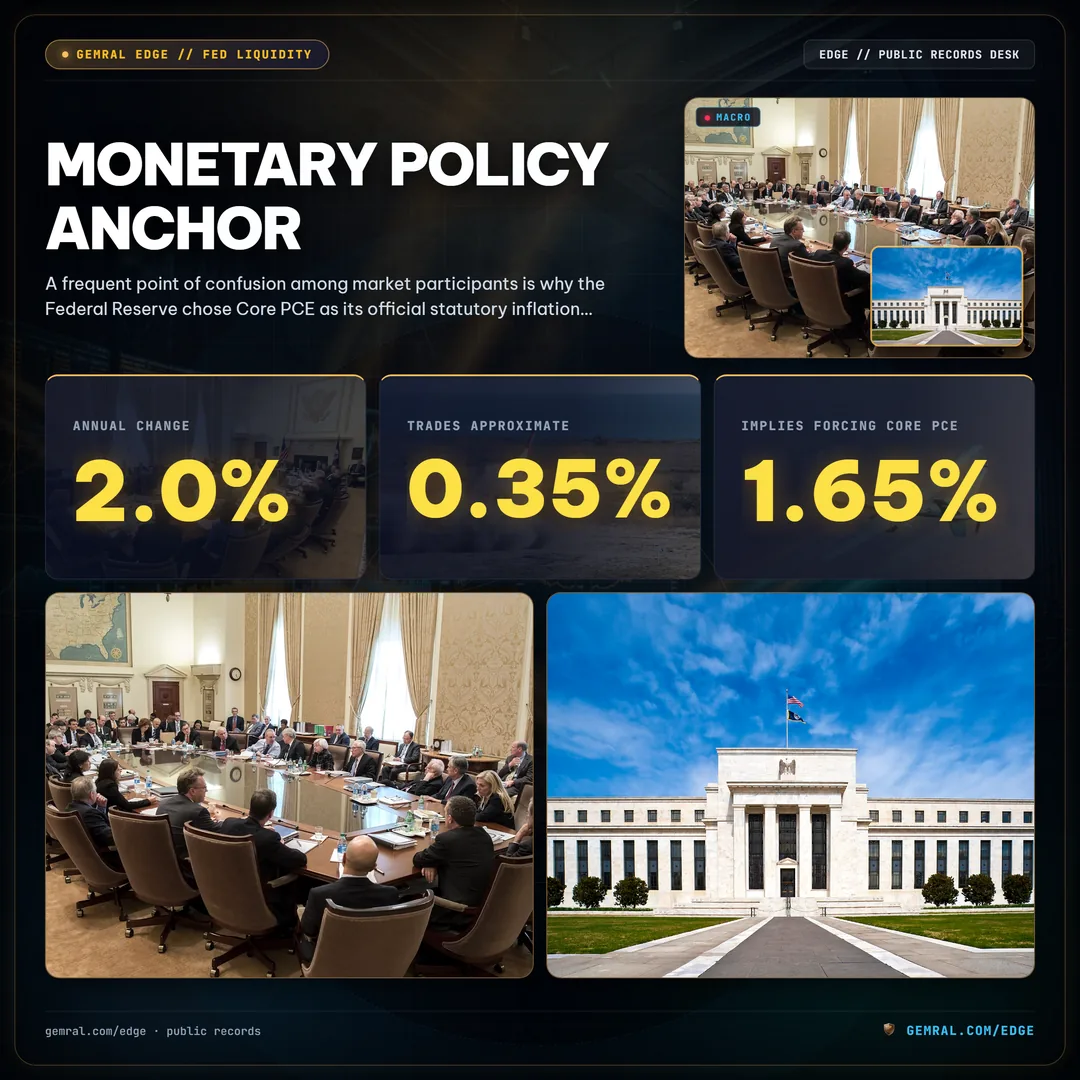
Throughout the 1980s and 1990s, the FOMC utilized the Consumer Price Index as its primary inflation benchmark. However, in its semiannual Monetary Policy Report to Congress submitted on February 17, 2000, Federal Reserve Chairman Alan Greenspan announced that the Committee would henceforth anchor its inflation forecasts and policy discussions around the PCE price index. In January 2012, under Chairman Ben Bernanke, the FOMC formalized this preference by adopting an explicit, numerical longer-run inflation goal of 2.0 percent for the annual change in the Headline PCE price index.
The Federal Reserve's formal preference for PCE over CPI rests on four explicit institutional rationales:
- Elimination of Substitution Bias: The Federal Reserve conducts monetary policy to manage aggregate macroeconomic demand. Because the chained Fisher-Ideal formula updates expenditure weights dynamically, PCE accurately captures how households alter their purchasing behavior in response to relative price shifts. Targeting an index with fixed-basket Laspeyres bias (such as CPI) would force the Fed to overtighten policy, suppressing economic growth to counteract statistical measurement error rather than genuine price pressure.
- Comprehensive Economic Scope: The FOMC's mandate covers the entire United States economy, not merely urban wage earners. PCE's incorporation of all 50 states, rural households, and domestic economic agents aligns directly with the central bank's national macroeconomic responsibilities.
- Superior Statistical Consistency with GDP: PCE represents the consumption expenditure component ($C$) of the fundamental national accounting identity ($Y = C + I + G + (X - M)$). By anchoring monetary policy to the exact price index used to deflate real Gross Domestic Product, the Federal Reserve ensures mathematical consistency between its inflation assessments and its real output growth models.
- Revisability and Historical Integrity: Unlike CPI, which cannot be revised retroactively, PCE is continuously backdated to incorporate comprehensive census revisions, improved seasonal adjustment factors, and refined methodology. This historical consistency allows the Federal Reserve's quantitative models to evaluate structural inflation regimes across multi-decade time horizons without statistical discontinuities.
The policy significance of this distinction cannot be overstated. If the Federal Reserve targeted Core CPI at 2.0 percent rather than Core PCE, it would mechanically enforce an even tighter monetary policy stance. Because Core CPI historically trades with an approximate 0.35 percent premium over Core PCE, achieving a 2.0 percent Core CPI rate implies forcing Core PCE down to approximately 1.65 percent—well below the central bank's declared target for sustainable macroeconomic stability.
The Historical Inflation Spread: Deconstructing the 30-to-50 Basis Point Wedge
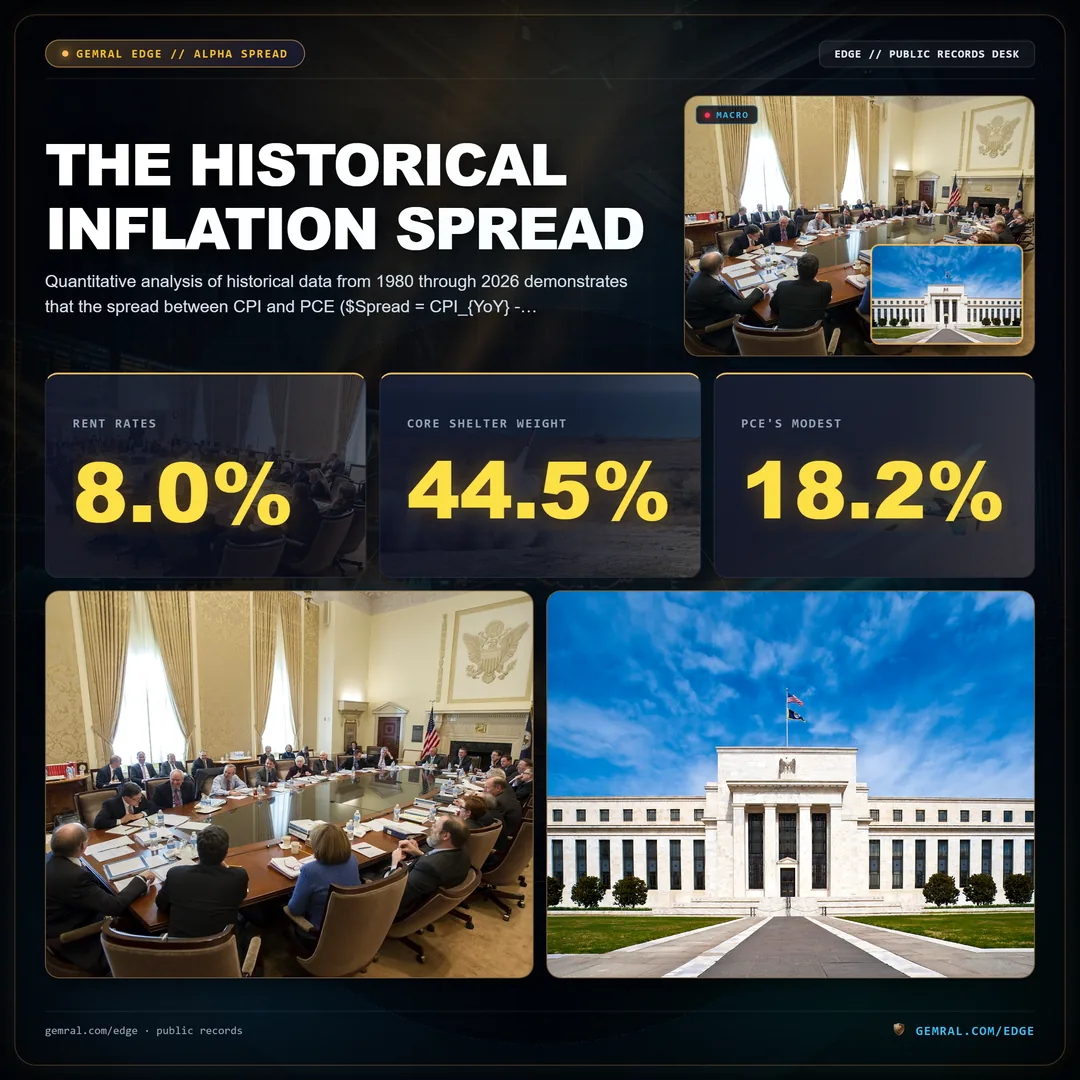
Quantitative analysis of historical data from 1980 through 2026 demonstrates that the spread between CPI and PCE ($Spread = CPI_{YoY} - PCE_{YoY}$) is positive, persistent, and structurally decomposable. Over the past 40 years, the average annual spread has hovered at approximately 0.35 percentage points (35 basis points) for headline figures, and approximately 0.40 percentage points (40 basis points) for core measures.
The Bureau of Economic Analysis regularly conducts formal econometric reconciliations to decompose this historical wedge into four distinct structural effects:
\Delta(CPI - PCE) = \text{Formula Effect} + \text{Weight Effect} + \text{Scope Effect} + \text{Seasonal/Other}
- Formula Effect (~0.15% to 0.20%): The mathematical difference resulting from CPI's modified Laspeyres fixed basket versus PCE's chained Fisher-Ideal index. This component is consistently positive, reflecting consumer substitution away from inflating goods.
- Weight Effect (~0.15% to 0.25%): The divergence caused by disparate category weightings, dominated by shelter (where CPI's heavy weighting exacerbates upward prints during housing booms) versus healthcare (where PCE's heavy weighting dampens total inflation when public reimbursement rates remain constrained).
- Scope Effect (~0.05% to 0.10%): The impact of items included in PCE but excluded from CPI (e.g., third-party healthcare outlays, non-profit institutions, imputed banking services), minus items where CPI sampling differs from PCE.
- Seasonal Adjustment & Other Residuals (~0.00% to 0.05%): Minor statistical drift resulting from differing independent seasonal adjustment filters and revised population benchmarks.
While the long-run median spread is 35 basis points, the spread exhibits substantial cyclical regime shifts. During commodity supply shocks, such as the 1990 Gulf War oil spike or the 2022 post-pandemic energy disruption, the spread between Headline CPI and Headline PCE widened to over 100 basis points due to CPI's higher direct retail energy weighting (6.7% vs 3.9%).
Even more pronounced regime shifts occur within core inflation metrics. Between mid-2022 and late 2024, Core CPI consistently outpaced Core PCE by 100 to 145 basis points. Because residential housing rents and Owners' Equivalent Rent surged at annualized rates exceeding 8.0 percent, CPI's 44.5 percent Core shelter weight generated substantial upward inertia. In contrast, PCE's modest 18.2 percent Core shelter weight, combined with subdued medical provider reimbursement caps, allowed Core PCE to decline toward 2.6 percent while Core CPI remained stubbornly pinned above 3.8 percent. Quantitative hedge funds that understood this structural decoupling generated substantial excess returns by exploiting the resulting mispricing in short-term interest rate futures and forward rate agreements.
Macro Calendar Sequencing: Dec 9 FOMC Projections vs Dec 10 November 2026 CPI
In macroeconomic execution, timing and calendar sequencing are as critical as mathematical formulas. A prime institutional case study in event sequencing unfolds in late 2026, where the Federal Reserve's monetary policy calendar directly intersects with the Bureau of Labor Statistics data release cycle.
On Wednesday, December 9, 2026, the Federal Open Market Committee concludes its final two-day policy meeting of the year. At 2:00 p.m. ET, the FOMC releases its formal interest rate policy statement and the quarterly Summary of Economic Projections (SEP), commonly referred to as the dot plot. The SEP presents the Committee's official economic forecasts for Gross Domestic Product growth, the unemployment rate, and critically, Headline and Core PCE inflation across 2026, 2027, and 2028.
Less than 19 hours later, on Thursday, December 10, 2026 at 8:30 a.m. ET, the Bureau of Labor Statistics releases the official November 2026 Consumer Price Index report. Institutional allocators tracking this sequence face a high-velocity event window governed by the following mechanics:
| Chronological Event Gate | Timestamp (ET) | Reporting Entity & Release Metric | Primary Transmission Conduit | Institutional Action Vector |
|---|---|---|---|---|
| Gate 1: FOMC Policy Decision | Dec 9, 2026 · 2:00 p.m. | Federal Reserve Rate Decision & Statement | Target Federal Funds Corridor (bps) | Adjust front-end SOFR and Treasury duration |
| Gate 2: SEP Dot Plot & PCE Forecasts | Dec 9, 2026 · 2:00 p.m. | FOMC Summary of Economic Projections (SEP) | Year-End 2026 & 2027 Core PCE Projections | Extract Fed's implied terminal real policy rate |
| Gate 3: Powell Press Conference | Dec 9, 2026 · 2:30 p.m. | Fed Chair Monetary Guidance Q&A | Verbal reaction function & inflation tolerance | Assess threshold for future policy adjustments |
| Gate 4: BLS November 2026 CPI Release | Dec 10, 2026 · 8:30 a.m. | Bureau of Labor Statistics (CPI-U MoM / YoY) | Headline CPI (est. 0.2% MoM) & Core CPI | Execute cross-asset dispersion and breakeven trades |
| Gate 5: BEA November 2026 PCE Release | Dec 23, 2026 · 8:30 a.m. | Bureau of Economic Analysis (Personal Income & Outlays) | Official Core PCE MoM & YoY deflators | Verify Fed SEP forecast alignment and rebalance |
Because the FOMC publishes its quarterly SEP projections based on Core PCE on December 9, central bank officials must finalize their rate decision without knowing the official November CPI print that will be published the following morning. If the November CPI report surprises significantly to the upside on December 10, market pricing for future rate adjustments will immediately disconnect from the fresh SEP dot plot published less than 24 hours prior.
Quantitative desks navigating this calendar sequence must evaluate how the incoming CPI components will translate into the subsequent November PCE report, scheduled for publication on December 23, 2026. Because analysts can directly map CPI motor vehicle prices, airline fares, and energy tariffs into the BEA's PCE framework, the December 10 CPI release serves as an empirical leading indicator that allows quantitative models to compute high-confidence estimates of the upcoming PCE print two full weeks before the BEA releases its official data.
Institutional Portfolio Playbook: Positioning for CPI-PCE Disconnects
To monetize the structural spread between cpi vs pce, quantitative asset managers and multi-strategy hedge funds execute systematic trading strategies designed to isolate relative pricing inefficiencies across fixed income, equity sectors, and digital asset liquidity. Institutional allocators should implement the following four-stage positioning framework:

1. TIPS Breakeven Inflation vs Federal Funds Target Arbitrage
Treasury Inflation-Protected Securities (TIPS) principal adjustments are legally indexed to the non-seasonally adjusted Consumer Price Index for All Urban Consumers (CPI-U). However, the Federal Reserve adjusts the nominal federal funds rate to manage Core PCE. Consequently, TIPS breakeven inflation rates reflect forward CPI expectations, while nominal Treasury yields reflect the Fed's PCE policy response.
When the market prices 5-year TIPS breakevens at an elevated premium over the Fed's 2.0 percent PCE target (e.g., breakevens trading at 2.65%), allocators must evaluate whether this spread merely reflects the structural 35-to-40 basis point CPI-PCE wedge plus an inflation risk premium, or genuine market overvaluation. When the breakeven spread expands beyond 65 basis points in the absence of severe commodity supply shocks, institutional desks initiate short breakeven positions (short TIPS, long nominal Treasuries) to capture mean-reversion toward historical structural spreads.
2. Equity Factor and Sector Spread Rotation
Divergences between CPI and PCE generate systematic factor rotations across public equity markets due to sectoral margin sensitivity:
- Healthcare Equipment & Managed Care: Highly sensitive to PCE healthcare inflation trends. When PCE healthcare metrics accelerate due to hospital reimbursement increases, managed care organizations face margin compression, while hospital operators and medical device manufacturers experience revenue expansion.
- Residential Real Estate Investment Trusts (REITs): Highly correlated with CPI shelter dynamics. When CPI shelter inflation remains elevated, residential landlords maintain strong pricing power and lease renewal spreads, supporting REIT earnings multiples even in high interest rate environments.
- Consumer Discretionary vs Staples: When CPI inflation substantially outpaces PCE, consumers face severe out-of-pocket budget constraints on basic necessities, dampening discretionary retail spending while preserving staples demand.
3. Cross-Checking Broad Monetary and Reserve Telemetry
Price index prints represent backward-looking lagging indicators of monetary velocity. To determine whether an unexpected spike in CPI or PCE reflects temporary supply chain frictions or genuine monetary debasement, institutional allocators cross-reference inflation prints against broad systemic liquidity barometers. Quantitative desks track global broad money expansion via our Global M2 Money Supply Chart and monitor domestic banking reserve trends through our Fed Net Liquidity Telemetry.
If Headline CPI surprises to the upside while Federal Reserve Net Liquidity is contracting and Treasury General Account (TGA) cash balances are accumulating, the inflation print represents a lagging statistical echo rather than a self-sustaining monetary expansion. In this regime, bond yield spikes present high-conviction duration buying opportunities.
4. Digital Asset Beta and Real Yield Transmission
Digital assets, led by Bitcoin ($BTC), operate as high-velocity barometers of global fiat liquidity and real interest rate expectations. Because the Federal Reserve calibrates policy to Core PCE, the real policy rate is defined as the nominal federal funds rate minus the Core PCE inflation rate:
r_{real} = i_{nominal} - \pi_{Core PCE}
When Core PCE declines faster than nominal policy rates, the real policy rate increases, tightening macroeconomic financial conditions and creating headwinds for digital store-of-value assets. Conversely, when Core PCE accelerates or when the FOMC cuts rates ahead of a declining PCE trajectory, real yields compress, unleashing accelerated liquidity expansions that historically trigger rapid capital inflows into Bitcoin and decentralized network protocols.
Macro Inflation FAQ: Consumer Price Index vs Personal Consumption Expenditures
What is the primary difference between CPI and PCE inflation?
The primary difference between CPI and PCE lies in formula mechanics, population scope, and expenditure weighting. The Consumer Price Index (CPI), published by the Bureau of Labor Statistics (BLS), measures out-of-pocket costs paid by urban households using a modified Laspeyres fixed basket. The Personal Consumption Expenditures (PCE) price index, published by the Bureau of Economic Analysis (BEA), measures total consumption across the entire domestic economy using a chained Fisher-Ideal formula that dynamically adjusts for consumer product substitution.
Why does the Federal Reserve target PCE instead of CPI?
The Federal Reserve formally adopted Core PCE as its official policy benchmark in February 2000 because its chained Fisher-Ideal formula eliminates upper-level substitution bias, its population scope covers all U.S. residents and non-profit institutions, and its comprehensive accounting aligns directly with the consumption deflator used in calculating real Gross Domestic Product (GDP).
Why does CPI inflation usually read higher than PCE inflation?
CPI inflation historically exceeds PCE inflation by an average of 30 to 50 basis points per year. This spread is driven by the formula effect (fixed baskets overstate price increases when consumers substitute cheaper goods) and the weight effect (CPI assigns a 36.2% weight to residential shelter, compared to only 15.5% in PCE, amplifying housing inflation in the CPI metric).
How does the December 2026 FOMC rate decision interact with the November CPI release?
The Federal Open Market Committee concludes its policy meeting and publishes its quarterly Summary of Economic Projections (SEP) on December 9, 2026, updating its official Core PCE forecasts less than 19 hours before the Bureau of Labor Statistics releases the November 2026 CPI report on December 10 at 8:30 a.m. ET. Institutional allocators utilize component-level data from the CPI report to pre-compute the subsequent PCE print scheduled for release on December 23, 2026.