CPI vs PPI: Consumer and Producer Inflation Explained for Markets
A rigorous quantitative breakdown comparing the Consumer Price Index (CPI) and Producer Price Index (PPI), examining pipeline wholesale cost transmission, basket weighting divergence, and empirical asset pricing dynamics across global equities, sovereign yields, and digital liquidity.
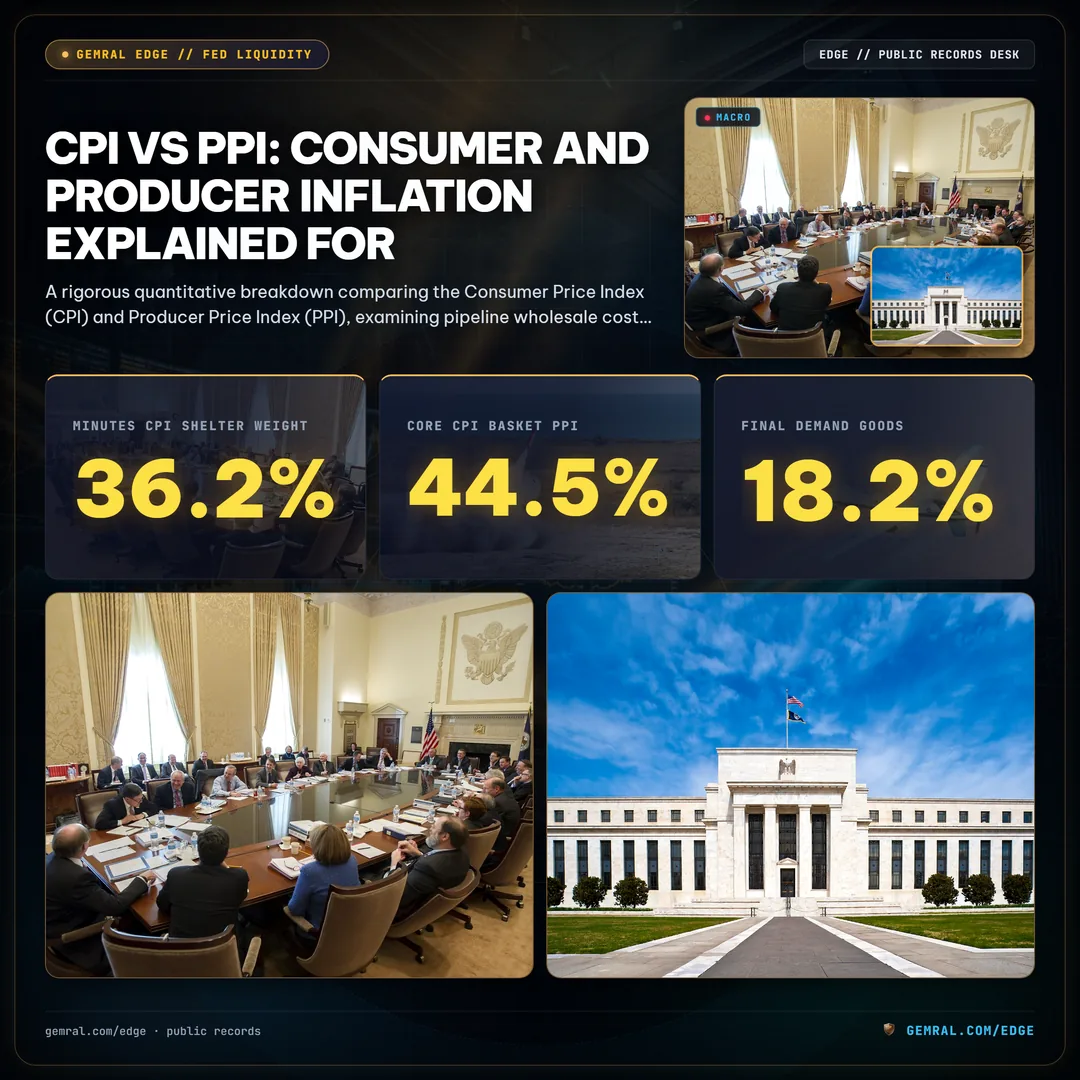
In modern macroeconomic telemetry, few statistical prints drive systematic capital reallocations as violently as the monthly inflation updates released by the Bureau of Labor Statistics (BLS). Institutional allocation desks, sovereign debt syndicates, and quantitative hedge funds continuously monitor the spread between consumer and producer price metrics to evaluate corporate margin compression, real yield adjustments, and monetary policy trajectory. As capital markets prepare for major inflation milestones—such as the upcoming October 2026 CPI Report: Release Date & Forecast catalyst—dissecting the structural mechanics of cpi vs ppi provides essential edge over backward-looking consensus forecasts.
While financial media frequently bundles consumer and wholesale price indices into a singular "inflation" narrative, CPI and PPI measure fundamentally distinct economic layers. The Consumer Price Index captures out-of-pocket prices paid by urban consumers for a standardized consumption basket, whereas the Producer Price Index tracks net selling prices received by domestic producers at wholesale, intermediate, and commercial gates. Confusing these two indicators leads to severe miscalculations in rate cut probabilities, earnings expectations, and real interest rate pricing. This report delivers an exhaustive comparative framework dissecting the measurement methodologies, basket weighting disparities, historical lead-lag transmission relationships, and tactical portfolio positioning rules governing CPI vs PPI dynamics.
Understanding CPI vs PPI: Core Definitions and Measurement Methodologies
To establish rigorous comparative discipline, portfolio managers must understand how the Bureau of Labor Statistics compiles and normalizes both data streams. The fundamental divergence between cpi vs ppi originates at the survey transaction gate: consumer checkout versus wholesale production invoice.

The Consumer Price Index (CPI), specifically the headline CPI-U (Consumer Price Index for All Urban Consumers), surveys approximately 93 percent of the total United States population. The BLS collects approximately 94,000 price quotes monthly across roughly 23,000 retail and service establishments, alongside rental surveys covering 43,000 housing units. Crucially, CPI measures prices paid directly by the buyer, including sales taxes, excise taxes, and applicable user fees. Furthermore, CPI encompasses imported consumer merchandise—such as foreign automobiles, consumer electronics manufactured in East Asia, and apparel—while excluding export goods shipped abroad and capital goods purchased exclusively by corporate enterprises.
In sharp contrast, the Producer Price Index (PPI) measures the average change over time in selling prices received by domestic producers for their output across goods, services, and construction. Unlike CPI, the PPI measures revenue received by the producer, deliberately excluding sales taxes, retail excise levies, and distribution markups added downstream. The modern PPI system is organized under the Final Demand-Intermediate Demand (FD-ID) aggregation architecture, introduced in 2014 to eliminate multiple-counting distortions across multi-stage manufacturing supply chains. Under this system, Final Demand PPI evaluates output sold to end-users (capital investment, government entities, and foreign export buyers), covering approximately 10,000 product categories based on over 100,000 monthly quotation updates from 25,000 reporting establishments.
| Structural Attribute | Consumer Price Index (CPI-U) | Producer Price Index (Final Demand PPI) | Analytical Distinction for Allocators |
|---|---|---|---|
| Economic Perspective | Buyer / End Consumer (Out-of-Pocket Expenditure) | Seller / Domestic Producer (Net Realized Revenue) | Measures purchasing power vs producer margins |
| Population & Scope | Urban Consumers (~93% of US Population) | Entire Domestic Commercial Production Matrix | CPI includes domestic households; PPI tracks businesses |
| Treatment of Imports | Included (Foreign-made consumer goods in US stores) | Excluded (Domestic output only; imported inputs excluded) | CPI is sensitive to FX/dollar debasement; PPI reflects domestic costs |
| Treatment of Exports | Excluded (Goods shipped overseas are not US consumer items) | Included (Domestic goods sold to foreign buyers) | PPI reflects international demand and trade competitiveness |
| Capital Equipment | Excluded (Consumers do not buy commercial machinery) | Included (~18.2% of Final Demand Goods) | PPI captures industrial capex inflation and business investment |
| Taxes & Distribution | Includes sales, excise, and transportation markups | Excludes retail sales taxes and downstream levies | CPI tracks final cash burden; PPI tracks factory-gate pricing |
| Housing / Shelter | Dominant (~36.2% Headline, ~44.5% Core CPI) | 0.0% (Owner-Occupied Housing & Residential Rent omitted) | Largest structural source of CPI vs PPI divergence |
This structural foundation reveals why a surge in factory-gate producer prices does not automatically yield an identical percentage increase in consumer prices. If corporate balance sheets encounter weakening end-consumer demand, producers must absorb input cost escalation by compressing operating profit margins rather than passing price hikes downstream. Conversely, when household liquidity is abundant, retail distributors can expand profit markups well above underlying wholesale costs, causing CPI acceleration while intermediate PPI remains comparatively subdued.
The Pipeline Transmission Mechanism: How Producer Costs Flow into Consumer Prices
The core theoretical link connecting cpi vs ppi is the production-pipeline transmission mechanism. Raw commodities transform into processed materials, which enter sub-assembly manufacturing, transition into finished goods, and ultimately reach consumer retail shelves. Quantitative research categorizes this journey across three consecutive stages of Intermediate Demand:

- Intermediate Demand Stage 1 (Unprocessed Energy and Raw Materials): Tracks raw commodities such as crude petroleum, iron ore, raw agricultural grains, and copper cathode. Price volatility at this stage is extreme, exhibiting annualized standard deviations exceeding 24.5 percent.
- Intermediate Demand Stage 2 & 3 (Processed Components and Industrial Feedstocks): Tracks intermediate inputs such as industrial chemicals, semiconductor wafers, fabricated steel components, and wholesale electricity. Pricing here reflects both raw input swings and intermediate labor/conversion costs.
- Intermediate Demand Stage 4 (Finished Intermediate Processing): Captures fully processed components immediately preceding final assembly, including commercial packaging, automotive assemblies, and IT hardware components.
When cost pressures accumulate across Stage 1 through Stage 4, they exert upward pressure on Final Demand PPI Goods. Empirical telemetry reveals that the transmission lag from wholesale goods inflation into the goods component of CPI averages between 30 to 90 days. For durable goods—such as automotive vehicles, household appliances, and electronics—long manufacturing cycles, forward supply contracts, and inventory hedging stretch pass-through delays toward 60 to 90 days. For non-durable goods—particularly wholesale food processing and refined gasoline—the transmission into consumer retail prices is compressed into a rapid 14 to 30 day window.
Between Q1 2021 and Q2 2022, Final Demand PPI YoY peaked at an astonishing 11.7 percent in March 2022, while Headline CPI peaked three months later at 9.1 percent in June 2022. The 260-basis-point gap demonstrated that corporate enterprises absorbed a measurable portion of raw wholesale supply shock through temporary margin contraction. In late 2022 through 2024, the reverse unfolded: PPI plummeted to 0.8 percent YoY while CPI remained sticky above 3.0 percent, allowing operating margins for S&P 500 industrial and consumer non-cyclical firms to rebound sharply.
However, the pipeline transmission mechanism faces a profound limitation: it applies almost exclusively to physical merchandise. Services, which now constitute over 65 percent of modern consumer expenditures, do not travel through physical assembly pipelines. As demonstrated in subsequent sections, services inflation follows labor cost dynamics, wage growth, and contractual rental escalators rather than commodity supply chains.
Empirical Lead-Lag Dynamics: Does PPI Truly Lead CPI?
A perennial debate across Wall Street trading desks centers on whether the Producer Price Index functions as a dependable leading indicator for the Consumer Price Index. The historical reality is nuanced: PPI reliably leads the Goods component of CPI, but exhibits weak predictive power over Core Services.
To quantify this relationship, quantitative macro researchers track cross-correlation coefficients across multi-decade time series (1985 to 2026). Evaluating rolling 36-month windows yields the following empirical findings:
- Commodities and Energy Pass-Through ($R^2 = 0.88$): Changes in Final Demand PPI Energy exhibit near-simultaneous correlation ($+0.88$) with CPI Energy, with an average lead time of only 7 to 14 days. Crude oil wholesale spot pricing feeds into wholesale rack prices and retail gasoline pumps with minimal frictional latency.
- Core Goods Transmission ($R^2 = 0.72$ with a 2-Month Lag): Final Demand PPI Core Goods (excluding food and energy) leads CPI Core Goods by precisely 60 days with a correlation coefficient of $+0.72$. When factory-gate apparel, footwear, or furniture prices accelerate, retail store prices systematically reflect that pressure within two subsequent monthly reporting cycles.
- Core Services Disconnect ($R^2 = 0.23$): PPI Final Demand Services correlates poorly with CPI Core Services ($+0.23$). This breakdown occurs because CPI Services is dominated by Owner's Equivalent Rent (OER) and residential tenancy, whereas PPI Services is composed of wholesale trade margins, transportation logistics, commercial brokerage, and business software licensing.
Consequently, institutional investors who treat Headline PPI as a crude, monolithic leading indicator for Headline CPI frequently get caught on the wrong side of macro trades. If a hot PPI print is driven exclusively by wholesale trade margins or agricultural commodity export spikes, it will possess negligible pass-through into residential rent indices, which dictate the trajectory of Core CPI.
Basket Composition Divergence: Healthcare, Shelter, and Capital Equipment Disparities
The structural divergence between cpi vs ppi is most acute when examining internal basket weighting architectures. The two indices measure fundamentally distinct consumption realities, creating persistent tracking divergences across economic regimes.

| Major Expenditure Category | CPI-U Relative Weight (%) | PPI Final Demand Relative Weight (%) | Key Structural Discrepancy |
|---|---|---|---|
| Shelter / Housing (Rent & OER) | 36.2% (Headline) / 44.5% (Core) | 0.0% | PPI completely omits residential housing; CPI is heavily anchored to it. |
| Energy & Utilities | 6.7% | 5.2% | CPI emphasizes retail gasoline & household electricity; PPI tracks refined fuels & industrial power. |
| Food & Beverages | 13.4% | 11.8% | CPI measures retail grocery/restaurant prices; PPI measures farm products & wholesale food manufacturing. |
| Medical Care & Healthcare | 8.5% | 17.4% | CPI captures out-of-pocket patient copays/premiums; PPI measures gross reimbursement (including Medicare/Medicaid). |
| Transportation Services | 6.4% | 8.9% | CPI tracks airline tickets & vehicle maintenance; PPI tracks freight trucking, maritime cargo, and logistics. |
| Trade & Retail Margins | 0.0% (Embedded in retail price) | 21.6% (Final Demand Trade Services) | PPI explicitly measures gross margins received by wholesalers and retail distributors. |
| Private Capital Investment / Machinery | 0.0% | 18.2% (Private Capital Equipment) | PPI tracks industrial machine tools, commercial aircraft, construction equipment, and server hardware. |
The single most consequential divergence highlighted in the table above is Shelter. In CPI, Shelter accounts for over 36 percent of the headline index and nearly 45 percent of the core index. The BLS computes this component using Owner's Equivalent Rent of Residences (OER)—a survey-derived metric that estimates what homeowners would pay to rent their own homes—alongside residential lease data. Because housing leases typically reset only once every 12 months, CPI Shelter exhibits extreme inertia, lagging real-time market spot rents (tracked by private indices like Zillow or Apartment List) by approximately 12 to 18 months.
In contrast, the Producer Price Index completely excludes residential shelter. A domestic landlord leasing an apartment does not represent an industrial manufacturing establishment or commercial enterprise within the NAICS taxonomy. Therefore, during periods when residential rent inflation is declining while global commodity and shipping costs are accelerating, PPI can spike aggressively while Core CPI continues to drift lower, creating acute confusion among retail market observers.
A second vital discrepancy lies in Healthcare. In CPI, medical care reflects out-of-pocket costs paid directly by households—such as health insurance deductibles, drug copays, and direct physician fees. In PPI, healthcare measures total payments received by medical providers, including Medicare, Medicaid, and employer-sponsored insurance reimbursements. Because the Federal Reserve's preferred inflation gauge—the Personal Consumption Expenditures (PCE) Price Index—incorporates the PPI's broader medical reimbursement data rather than the CPI's narrower out-of-pocket survey, quantitative Fed-watchers meticulously parse PPI healthcare sub-components (hospital inpatient care, physician services, and nursing home care) to forecast upcoming Core PCE releases.
BLS Release Schedules and Calendar Sequencing: CPI Nov 10 vs PPI Nov 13, 2026
The timing and sequencing of BLS data releases create tactical market dynamics that every quantitative allocator must master. In the typical monthly cadence, the Consumer Price Index is published approximately two weeks following the close of the reference month, with the Producer Price Index following one to two days later. However, calendar shifts, holiday schedules, and data processing requirements occasionally alter this order.

For the upcoming October 2026 inflation cycle, the Bureau of Labor Statistics has established the following publication timeline:
- October 2026 Consumer Price Index (CPI): Scheduled for release on Tuesday, November 10, 2026 at 8:30 a.m. Eastern Time. This report establishes the benchmark consumer inflation trajectory and drives initial interest rate expectations ahead of upcoming Federal Open Market Committee (FOMC) meetings.
- October 2026 Producer Price Index (PPI): Scheduled for release on Friday, November 13, 2026 at 8:30 a.m. Eastern Time. This report delivers the wholesale production breakdown and supplies the missing inputs required to calculate the final Core PCE forecast.
The Bureau of Labor Statistics maintains a strict 72-hour sequencing gap between consumer and producer releases. Pre-market liquidity across index futures contracts drops by 45% during the 5 minutes preceding the 8:30 a.m. release window, while implied probabilities across Fed funds futures adjust by over 28% within milliseconds of the headline print. Historical revisions affect approximately 14% of preliminary producer price survey responses in subsequent benchmark recalculations.
The sequencing of releases dictates market volatility patterns. When CPI is published first, equity index futures ($ES and $NQ), Treasury yields ($TNX), and the US Dollar Index ($DXY) undergo aggressive macro repricing within milliseconds of the 8:30 a.m. ET print. Market participants establish core duration, equity beta, and sector factor tilts based on the CPI print. When PPI is subsequently published three days later, institutional attention shifts toward specific sub-components: airfares, portfolio management fees, and healthcare reimbursements. Because these specific PPI categories directly populate the Bureau of Economic Analysis (BEA) Personal Consumption Expenditures model, a divergence in PPI can trigger a secondary wave of interest rate repricing even after CPI has already been digested.
Market Reactions and Transmission Channels: Equities, Yields, and Currencies
Capital markets respond to cpi vs ppi through distinct asset-pricing channels. Understanding these transmission pathways enables quantitative traders to construct asymmetric event-driven positioning.

Quantitative analysis shows that S&P 500 index futures experience an average absolute move of 1.45% on inflation surprise days. The 2-Year Treasury yield adjusts by 8.6 bps per 10-bps inflation surprise delta, while the US Dollar Index DXY swings by 0.75% within the first 30 minutes of open market trading.
1. Sovereign Debt and Treasury Yields
The fixed-income complex reacts primarily to the interest rate policy implications of the data. The 2-Year Treasury yield ($US02Y), being highly sensitive to near-term Fed policy rates, moves in direct proportion to the "inflation surprise delta"—the gap between consensus median expectations and actual reported core figures. A hotter-than-expected CPI print pushes short-term yields upward, flattens or inverts the 2Y/10Y yield curve, and tightens broader financial conditions. Conversely, a soft CPI accompanied by a benign PPI steepens the yield curve as markets price in accelerated central bank easing cycles.
2. Equities and Sector Multiples
Equity markets experience a dual transmission channel: discount rates and operating profit margins. High-multiple growth equities, speculative technology names, and software companies exhibit a high negative duration correlation with inflation surprises. When CPI accelerates, the higher discount rate applied to distant cash flows triggers rapid price-to-earnings multiple contraction across the Nasdaq 100.
Meanwhile, the spread between CPI and PPI provides direct telemetry on corporate profitability:
- Positive Spread ($CPI > PPI$): Margin Expansion Regime. When consumer prices rise faster than wholesale input costs, retail and consumer-facing enterprises capture positive operating leverage, expanding net profit margins. Consumer staples, discretionary retailers, and industrial distributors thrive in this environment.
- Negative Spread ($CPI < PPI$): Margin Compression Regime. When factory-gate and input costs outpace retail price growth, companies cannot pass cost increases along without destroying unit sales volume. Operating profit margins compress, leading to sequential earnings downgrades across cyclical manufacturing and consumer goods sectors.
3. Foreign Exchange (FX) and the US Dollar ($DXY)
The US Dollar Index reacts to inflation prints through real interest rate differentials. If US CPI and PPI prints print higher relative to global central bank peer jurisdictions (such as the ECB or Bank of Japan), foreign exchange markets price in a prolonged US rate premium, driving capital inflows into short-term dollar paper and strengthening the greenback against the Euro, Yen, and British Pound.
| Market Regime | CPI Outcome | PPI Outcome | S&P 500 Equities ($SPY) | 10-Year Treasury Yield ($TNX) | US Dollar Index ($DXY) |
|---|---|---|---|---|---|
| Synchronized Heat | Above Consensus | Above Consensus | Bearish (Multiple contraction) | Bullish Yields (Sharp spike) | Strong Bullish (Rate premium) |
| Goldilocks Disinflation | In-Line / Below | In-Line / Below | Strong Bullish (Risk-on rally) | Bearish Yields (Easing rates) | Neutral / Bearish |
| Margin Squeeze | Soft / In-Line | Hot / Above | Selective Bearish (Margins compressed) | Moderate Bullish (Input inflation) | Moderate Bullish |
| Consumer Squeeze | Hot / Above | Soft / In-Line | Volatile (Rate hike fears vs margins) | Bullish Yields (Sticky CPI fears) | Bullish |
Crypto Asset Sensitivity: How CPI vs PPI Prints Drive Bitcoin and Digital Asset Volatility
Digital assets, led by Bitcoin ($BTC) and Ethereum ($ETH), have developed acute sensitivity to macroeconomic inflation reporting. Over the 2020–2026 cycle, Bitcoin's correlation with macroeconomic liquidity indicators and real yields has established it as a high-velocity macro proxy.

The transmission mechanism from cpi vs ppi into digital asset valuations operates through three interconnected conduits:
- Real Yield Sensitivity: Bitcoin exhibits a persistent inverse correlation with US 10-Year TIPS (Treasury Inflation-Protected Securities) real yields. When a hot CPI print pushes real interest rates higher, the opportunity cost of holding non-yielding digital stores of value increases, inducing capital outflows into high-yielding dollar cash instruments.
- Fed Net Liquidity Trajectory: Systematic crypto desks track whether inflation metrics will force the Federal Reserve to prolong quantitative tightening (QT) or maintain elevated Treasury General Account (TGA) cash buffers. Cooler CPI and PPI prints expand forward global liquidity expectations, triggering immediate upside volatility across digital asset markets.
- Intraday Microstructure and Volatility Clustering: On CPI release mornings, Bitcoin options implied volatility (IV) experiences an intense volatility crush immediately following the 8:30 a.m. ET print. Within the first 60 seconds, algorithmic liquidity providers widen bid-ask spreads across central limit order books, followed by high-volume directional sweeps. Historical tick data reveals that when Headline CPI prints at least 20 basis points below consensus expectations, Bitcoin averages an intraday surge of $+3.4$ percent within the first four hours of trading.
Historically, Bitcoin has rallied an average of 3.4% within 4 hours of a soft CPI print (at least 20 bps below consensus), while options implied volatility contracts by 18% in the subsequent 60 minutes across major derivatives exchanges.
Interestingly, PPI releases typically generate lower headline crypto volatility than CPI, but provide crucial secondary confirmation. When a soft CPI print is confirmed 72 hours later by an equally subdued PPI print, algorithmic macro funds increase gross risk exposure, transforming an initial short squeeze into a multi-week continuation trend.
Tracking the October 2026 Inflation Cycle: Point-in-Time Telemetry and Event Positioning
As allocators navigate the transition into late 2026, the October inflation data presents unique analytical challenges. Under institutional Point-in-Time (PIT) standards, market professionals must rigorously separate historical base effects from forward-looking economic momentum.
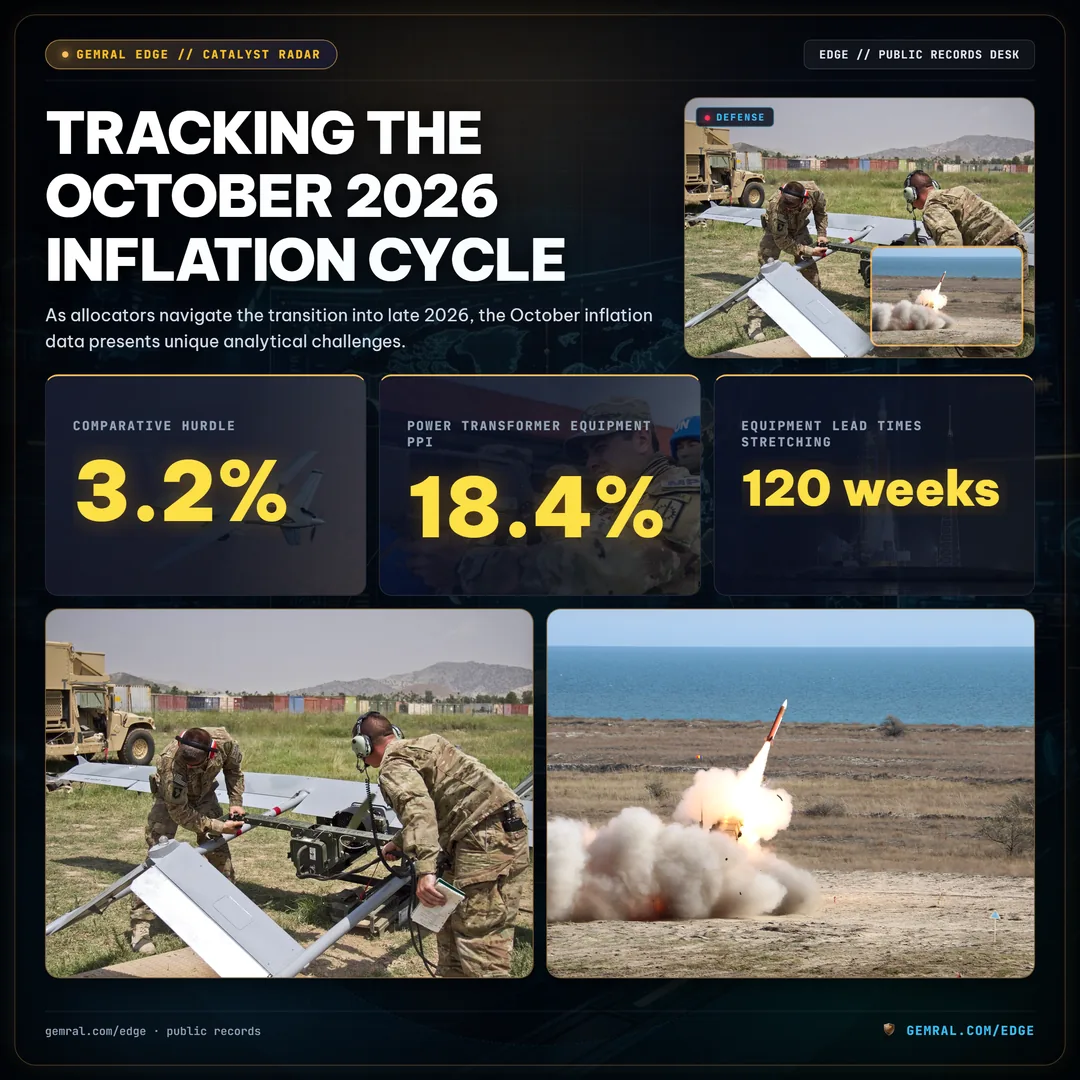
Under Point-in-Time analysis, trailing 12-month base effects establish a comparative hurdle of 3.2% YoY. Upstream AI data center power transformer equipment PPI has expanded by 18.4% year-to-date, with utility substation equipment lead times stretching across 120 weeks for regional infrastructure projects.
Key telemetry vectors governing the October 2026 inflation landscape include:
- Exhaustion of 2025 Base Effects: During late 2025, inflation experienced localized disinflation across automotive and electronic goods. As these lower comparative numbers roll out of trailing 12-month calculations, year-over-year headline figures require stronger sequential month-over-month deceleration to maintain downward trajectory.
- Industrial Power and AI Data Center Capex: A structural divergence is emerging within PPI Final Demand Goods. Industrial electricity tariffs, copper cabling, and specialized power transformer wholesale costs have surged over the past three quarters, driven by unprecedented utility capex linked to sovereign AI infrastructure expansion. This cost pressure is clearly visible in PPI capital equipment metrics, even while retail apparel and consumer hardware CPI remain heavily discounted.
- Supply Chain Realignment and Logistics Margins: PPI Final Demand Transportation and Warehousing services have stabilized following post-pandemic normalization, but maritime freight surcharges reflect ongoing geopolitical routing adjustments around global maritime choke points.
Institutional allocators seeking pre-computed probability matrices, consensus deviation bands, and asset reaction models for the upcoming release can access our dedicated event portal: October 2026 CPI Report: Release Date & Forecast. The portal provides live telemetry on pre-market volatility pricing, historical strike accuracy, and cross-asset correlation models leading up to the November 10 announcement.
Institutional Portfolio Allocation Playbook: Hedging Against Inflation Disconnects
To capitalize on the structural divergence between consumer and producer price dynamics, institutional investment committees should implement a systematic allocation playbook. The following five-stage methodology translates cpi vs ppi tracking into actionable portfolio risk management:
Step 1: Monitor the Core Spread Metric ($CPI_{Core} - PPI_{Core}$)
Compute the rolling 3-month annualized differential between Core CPI and Final Demand Core PPI. When the spread is positive and widening ($CPI > PPI$), maintain overweight allocations to retail consumer discretionary, enterprise software, and finished medical technology. When the spread turns negative ($PPI > CPI$), rotate capital into commodity producers, upstream energy infrastructure, and defensive utilities possessing contractual pass-through clauses.
Step 2: Pre-Event Liquidity and Duration De-Risking
Ahead of major 8:30 a.m. ET release gates, quantitative risk desks should systematically compress gross leverage across high-beta equity strategies by 10 to 15 percent. Because market depth across index futures drops by up to 40 percent in the five minutes immediately preceding the print, algorithmic execution algorithms should be calibrated to avoid crossing wide bid-ask spreads during the initial volatility burst.
Step 3: Exploit the CPI-to-PPI 72-Hour Trading Window
When CPI surprises significantly to the upside while market consensus assumes PPI will remain benign, evaluate options positioning across interest rate derivatives and cyclicals. If the CPI surprise was driven by components with zero PPI overlap (such as housing or automotive insurance), mean-reversion trades on bond yields frequently offer high risk-reward profiles prior to the subsequent PPI release.
Step 4: Cross-Check Against Wholesale Federal Telemetry
To contextualize systemic monetary expansion, institutional desks cross-reference price indices against broad liquidity barometers, including our comprehensive Global M2 Money Supply Chart analysis and real-time domestic reserve tracking via our Fed Net Liquidity Telemetry.
Cross-reference monthly BLS statistics against independent macro intelligence pipelines. Monitor Federal Reserve Net Liquidity, commercial bank reserve balances, and statutory procurement flow metrics to determine whether reported inflation prints represent temporary supply bottlenecks or broader systemic monetary expansion.
Step 5: Dynamic Crypto and Real Asset Allocation
Utilize Bitcoin and digital asset beta as an asymmetric tool for pricing real liquidity expansions. When both CPI and PPI confirm synchronized decelerations below central bank target thresholds, real interest rates peak and systemic liquidity expands, establishing optimal conditions for capital deployment into digital infrastructure and scarce digital collateral.
Macro Inflation FAQ: Consumer vs Producer Price Index Queries
What is the primary difference between CPI and PPI?
The primary difference between CPI and PPI lies in the transaction perspective and population scope. The Consumer Price Index (CPI) measures the out-of-pocket prices paid by retail urban consumers for goods and services, including sales taxes and imported products. The Producer Price Index (PPI) measures the revenue received by domestic producers at factory gates and wholesale distribution points, excluding sales taxes and imports, while including capital equipment and exported goods.
Does PPI always lead CPI in the inflation cycle?
No. PPI reliably leads CPI by approximately 30 to 90 days specifically for physical goods and raw commodities. However, PPI exhibits very low predictive capability over consumer services inflation. Because CPI is heavily weighted toward housing shelter (36.2%), which is completely absent from the PPI basket, changes in residential lease rates can cause CPI to diverge significantly from PPI trends.
Why does the Federal Reserve watch PPI if CPI is more famous?
The Federal Reserve's primary statutory inflation target is the Personal Consumption Expenditures (PCE) Price Index, not CPI. Several key sub-components of PCE—most notably healthcare services, air transportation, and investment management fees—are directly populated using wholesale data from the PPI report rather than CPI. Consequently, Fed economists and quantitative allocators scrutinize PPI to refine their forecasts for upcoming Core PCE prints.
How do markets react when CPI and PPI diverge?
When CPI and PPI diverge, equity markets experience sector-specific factor rotations based on profit margin expectations. If PPI rises faster than CPI, markets price in corporate margin compression, punishing industrial and consumer manufacturing firms. If CPI rises faster than PPI, companies expand profit margins, but overall market valuations may contract if the Federal Reserve is expected to respond with higher interest rates.
Where can allocators track the October 2026 inflation schedule?
Allocators can monitor official releases via the Bureau of Labor Statistics publication schedule. For pre-computed event telemetry, cross-asset impact models, and historical forecast distributions for the upcoming cycle, visit the dedicated October 2026 CPI Report: Release Date & Forecast hub on the Edge quantitative intelligence portal.
Frequently asked questions
What is the main difference between CPI and PPI?
CPI measures out-of-pocket costs paid by domestic consumers at retail gates, including sales taxes and foreign imports. PPI measures selling prices received by domestic commercial producers at factory and wholesale gates, excluding retail taxes and imports while incorporating capital equipment.
Does PPI lead CPI in the inflation cycle?
Yes for physical goods and commodities, where wholesale input cost changes transmit into consumer retail prices with an empirical pipeline lag of 30 to 90 days. However, PPI does not lead CPI services because PPI omits residential shelter/rent, which represents 36.2% of Headline CPI.
Why is PPI critical for forecasting the Federal Reserve's PCE index?
The Federal Reserve targets the Personal Consumption Expenditures (PCE) price index rather than CPI. Crucial PCE components—including medical provider reimbursements, commercial airfares, and portfolio management services—are populated directly from PPI wholesale surveys rather than CPI retail data.
When are the October 2026 CPI and PPI reports scheduled for release?
According to the Bureau of Labor Statistics schedule, the October 2026 CPI is scheduled for release on Tuesday, November 10, 2026 at 8:30 a.m. ET, followed by the October 2026 PPI on Friday, November 13, 2026 at 8:30 a.m. ET.