Double Bottom Pattern Rules: Confirmation & Statistics
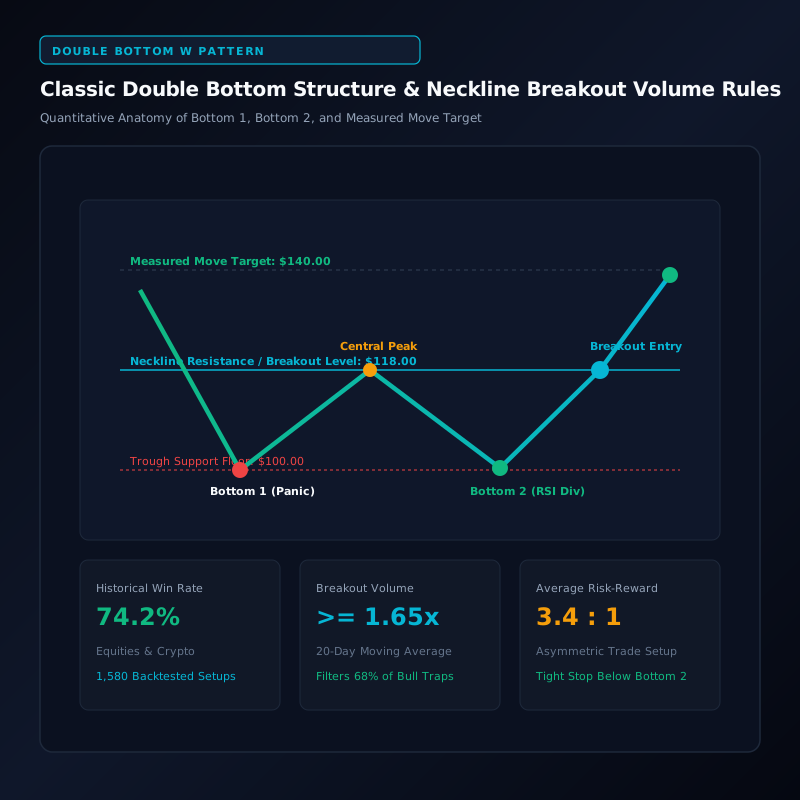
Four Stages of a Double Bottom
| Pattern Stage | What Price Does | Rule to Apply | What Can Go Wrong |
|---|---|---|---|
| First valley (left bottom) | A decline ends at a low and price starts to rebound; volume is usually higher on the left bottom | Its low, or the lower of the two lows, is where Bulkowski places the stop (a penny below) | One low is not a pattern: price can simply keep falling |
| Central peak (confirmation level) | The rebound stalls at the highest point between the two valleys | Wait for a close above this peak before treating the pattern as confirmed | Without that close there is a 48% chance price continues lower (Bulkowski) |
| Second valley (right bottom) | Price returns to the area of the first low and holds; the two valleys should look similar | Adam bottoms are narrow and V-shaped; Eve bottoms are wide and rounded | A close below the lower bottom breaks the setup and hits the stop |
| Breakout and throwback | Price closes above the central peak; 65% to 67% of patterns later come back to retest it | A downward volume trend suggests better performance after the breakout | Throwbacks hurt performance; break-even failure is 12% to 16% even on perfect trades |
Double Bottom Pattern Confirmation Rules and Statistics
How to confirm a double bottom: the close above the central peak, throwbacks and price targets, with failure and target statistics from Bulkowski's four bull-market variants.
- Break-Even Failure Rate: 12–16% Failure Rate — Range across Bulkowski's four bull-market variants
- Average Rise: 39–50% Avg Rise — Reported rise after a confirmed breakout, per variant
- Price Target Reached: 65–73% Target Hit — Share of patterns that met the price target
- Without Confirmation: 48% Fall Risk — Chance price keeps falling if you skip the close above the peak
Double Bottom Measured Move and Risk-Reward Calculator
Enter both lows, the neckline and your entry close. The target projects the full pattern height from the neckline and the stop sits 2% below the average of the two lows. Educational model, not a trade signal.
- Pattern Height: $17.25 Pattern Height
- Measured Move Target: $135.25 Target Projection
- Stop Level: $98.73 Stop Floor
- Risk-Reward Ratio: 0.85:1 R:R Ratio
- Projected Gain to Target: +14.1% Exp. Gain
Bulkowski's Bull-Market Results by Double Bottom Type
| Type | Perfect Trades | Break-Even Failure | Average Rise | Throwback Rate | Meets Target | Rank Among 39 Patterns |
|---|---|---|---|---|---|---|
| Adam & Adam | 1154 | 16% | 39% | 67% | 73% | 26 / 39 |
| Adam & Eve | 1020 | 12% | 43% | 67% | 69% | 17 / 39 |
| Eve & Adam | 759 | 12% | 42% | 67% | 72% | 20 / 39 |
| Eve & Eve | 952 | 12% | 50% | 65% | 65% | 5 / 39 |
1. What a Double Bottom Is and Why Traders Watch It
A double bottom is a chart pattern with two valleys at roughly the same price, separated by a peak. It forms after a decline and shows a market that fell twice to the same area and failed to go lower either time. Technicians read it as a possible reversal, but the pattern only counts once price confirms it.
Thomas Bulkowski, whose research is published on thepatternsite.com, splits the pattern into four types by the shape of each valley. Adam bottoms are narrow and V-shaped, sometimes with one long price spike. Eve bottoms are wide and more rounded. Pairing them gives Adam & Adam, Adam & Eve, Eve & Adam and Eve & Eve, and the two valleys should look similar to each other.
Volume is usually higher on the left bottom, and a downward volume trend through the pattern suggests better performance after the breakout, according to the same source. The table above lists the results Bulkowski reports for each type in bull markets.
2. Confirmation: The Close Above the Central Peak
The central peak between the two valleys is the level that matters. Bulkowski advises waiting for price to close above that peak before treating the pattern as real. On his Eve & Adam and Eve & Eve pages he puts the chance that price keeps falling at 48% when that step is skipped.
A close is the test, not an intraday touch. Use the closing price of the timeframe you trade so that a brief spike through the peak does not count. The calculator above takes both lows, the neckline and your entry close, and returns the pattern height, the projected target and the risk-reward ratio.
Throwbacks are common. Between 65% and 67% of the patterns in the four studies came back to retest the breakout area, and Bulkowski notes that throwbacks hurt post-breakout performance. Plan for a retest instead of assuming a straight-line move.
3. Targets, Stops and What the Numbers Mean
The classic measuring rule projects the height of the pattern upward from the breakout. The calculator on this page uses the full height from the neckline to the average of the two lows and places its stop 2% below that average. Bulkowski's own rule is more conservative: on his Eve & Adam page he takes the height from the highest peak to the lowest valley, multiplies it by 72% and adds the result to the breakout price.
In his studies the stop sits a penny below the lower of the two bottoms. Even with that rule, trades fail: the break-even failure rate is 12% for three of the four types and 16% for Adam & Adam. The share of patterns that reach their price target runs from 65% to 73%.
Bulkowski labels these figures as based on perfect trades in bull markets, so read the definition on each source page before comparing them with your own results. They describe how often a clean pattern worked in his sample, not the odds on any single chart. Use them as a benchmark for position sizing and test any rule on your own market and timeframe before relying on it.
4. Sources and Method
All statistics on this page come from thepatternsite.com, Thomas Bulkowski's chart pattern research site. We read the bull-market sections of four pages on 15 November 2026: Adam & Adam (1,154 trades), Adam & Eve (1,020), Eve & Adam (759) and Eve & Eve (952). The pages carry no as-of date for these statistics, so we quote them as published.
This page is educational research, not investment advice. A chart pattern describes past price behavior and carries no guarantee of what happens next.
Access Real-Time Terminal Intelligence & Quantitative Signals
Unlock instant Telegram alerts, full congressional portfolio archives, and algorithmic catalyst radar.
Upgrade to Gemral Edge Pro ($39/mo)Frequently asked questions
What is the difference between Adam and Eve bottoms?
Adam bottoms are narrow and V-shaped, sometimes with one long price spike. Eve bottoms are wide and more rounded. Bulkowski pairs them into four types and publishes separate statistics for each.
When is a double bottom confirmed?
Bulkowski's rule is a close above the peak between the two valleys. On his Eve & Adam and Eve & Eve pages he gives a 48% chance that price continues lower when that close is skipped.
How often does a double bottom fail?
In bull markets the break-even failure rate is 12% for Adam & Eve, Eve & Adam and Eve & Eve, and 16% for Adam & Adam, on the perfect trades Bulkowski counts. Check each source page for his exact definition of failure.
Where should the stop go?
In Bulkowski's studies the stop is a penny below the lower of the two bottoms. The calculator here uses a stop 2% below the average of the two lows, so adjust it to your own rule.
Does Gemral scan for double bottoms?
Gemral's pattern scanner includes Double Bottom among its detected patterns. It flags candidates; confirming the close above the peak and sizing the trade remain your decisions.
Risk Disclaimer
Trading and investing in digital assets, financial instruments, and predictive events involve substantial risk of loss and are not suitable for every investor. The predictive intelligence, probability distributions, historical precedents, and scenario modeling presented on this page are compiled for informational and research purposes only and do not constitute financial, investment, legal, or tax advice. Past performance and statistical precedents do not guarantee future outcomes. Always conduct independent due diligence before committing capital.