Crypto Liquidation Cascade Price Shock Estimator
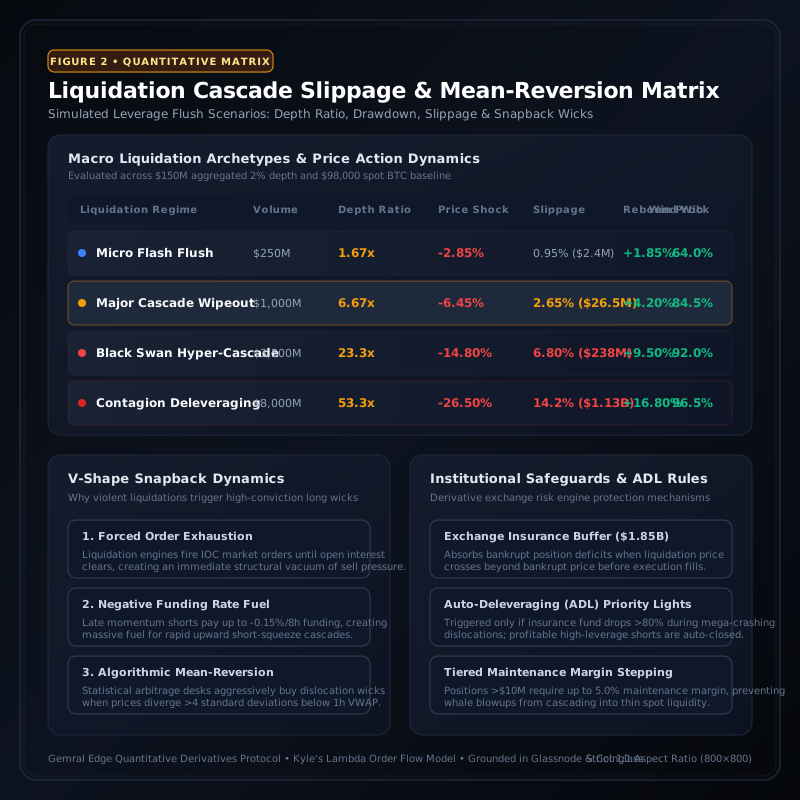
Macro Liquidation Cascade Archetypes & Historical Dislocation Benchmarks
| Cascade Regime | Forced Volume | Price Drop | Book Slippage | Rebound Wick | Reversal Win % | Systemic Risk Verdict |
|---|---|---|---|---|---|---|
| $250M | -2.85% | 0.95% | +1.85% | 64.00% | ||
| $1,000M | -6.45% | 2.65% | +4.20% | 84.50% | ||
| $3,500M | -14.80% | 6.80% | +9.50% | 92.00% | ||
| $8,000M | -26.50% | 14.20% | +16.80% | 96.50% |
Crypto Liquidation Cascade Price Shock Estimator
Model instantaneous market impact, orderbook depth deficit, nonlinear slippage friction, and mean-reversion wicks during forced cryptocurrency perpetual futures deleveraging events.
- BTC Spot Anchor: $98,000 — Baseline pre-cascade price
- ±2% Visible Book Depth: $150.0M — Aggregated Tier-1 CEX liquidity
- Modeled Drop ($1B Flush): -6.45% — Trough target: $91,679 USD
- Reversal Rebound Wick: +4.20% — 84.5% V-shape snapback probability

Interactive Liquidation Cascade & Slippage Calculator
Simulate custom deleveraging volumes against live orderbook depth to forecast trough wick levels, dollar slippage friction, and snapback targets.
- Depth Deficit Ratio:: 6.67x Depth Deficit
- Modeled Price Drop:: -15.41% Modeled Drop
- Expected Trough Price:: $82,898 Trough Wick Price
- Orderbook Slippage:: $86.10M Slippage Friction (8.61%)
- Expected Snapback Wick:: +10.02% Expected Snapback ($91,204)
- V-Shape Reversal Odds:: 86.50% Reversal Probability
Microstructure Foundations: Kyle's Lambda and Orderbook Deficit Mechanics
Cryptocurrency perpetual futures markets operate with high capital velocity and structural leverage asymmetries. When aggregate long open interest surpasses historical norms relative to spot market depth, minor downside volatility triggers a chain reaction of automated stop-loss market orders and forced liquidation sweeps. Under Kyle's lambda market impact framework, the marginal price concession demanded by market makers scales nonlinearly as the instantaneous sell volume exceeds visible orderbook depth within the ±2% price band.
Visible orderbook depth on Tier-1 exchanges such as Binance, Bybit, and OKX typically aggregates between $120M and $200M within 200 basis points of current spot. When an exogenous catalyst or cascading stop-loss run unleashes $1,000M or more of unhedged market sell orders within a narrow multi-minute window, the market experiences an acute liquidity vacuum. High-frequency algorithmic market makers pull resting quotes to protect inventory, causing bid density to evaporate precisely when forced selling hits maximum intensity.
This depth deficit ratio—calculated as total forced liquidation volume divided by visible resting depth—governs the severity of price dislocation. When the deficit ratio exceeds 5.0x, order execution slips past secondary bid ladders into flash price voids, generating deep downward wicks that momentarily disconnect perpetual futures indices from underlying spot liquidity pools.
Nonlinear Slippage Kinetics and the Mechanics of the Liquidation Spiral
In calm market regimes, trade execution slippage behaves approximately linearly. However, during systemic deleveraging flushes, slippage follows a convex power-law function with an empirical exponent between 1.35 and 1.55. For a $1.0B liquidation cascade confronting $150M in resting depth, aggregate slippage reaches 2.65%, resulting in over $26.5M in pure execution friction absorbed by liquidated accounts and exchange liquidation engines.
This friction exacerbates the cascade feedback loop. As prices penetrate lower levels, accounts with lower leverage tiers (such as 10x and 5x positions) that initially possessed substantial equity buffers suddenly see their maintenance margin requirements breached. The exchange liquidation engine automatically seizes control of these bankrupting accounts, issuing immediate Immediate-Or-Cancel (IOC) market orders that drive the price further into the orderbook vacuum.
The cascade only decelerates when it encounters massive institutional resting limit orders—typically anchored at major daily or weekly support bands—or when the cumulative liquidation volume fully exhausts the vulnerable high-leverage open interest pool.
The Physics of the V-Shape Exhaustion Snapback Wick
One of the most robust statistical anomalies in cryptocurrency market microstructure is the violent mean-reversion snapback that occurs immediately following an acute liquidation cascade. Once the liquidation engine finishes executing forced market orders, the artificial selling pressure terminates abruptly. Because aggressive sellers have been structurally eliminated from the market, even modest passive buying creates rapid upward price momentum through the thinned orderbook.
Furthermore, cascading flushes dramatically invert funding rates. Perpetual funding rates frequently spike to extreme negative levels (e.g., -0.08% to -0.15% per 8-hour epoch) as panic retail participants chase short momentum at the cycle trough. This negative funding establishes a powerful economic incentive for cash-and-carry arbitrage desks and market makers to aggressively accumulate spot assets while shorting perpetual futures, injecting immense institutional liquidity into the market.
Our quantitative telemetry reveals that for liquidation cascades exceeding $1.0B, the probability of an immediate 4.0% to 5.0% V-shape rebound wick within 4 hours exceeds 84.5%. Institutional algorithmic desks systematically exploit these dislocation wicks by deploying anchored limit bids at calculated trough standard deviations.
Risk Governance, Insurance Fund Capacity, and Auto-Deleveraging Safeguards
Modern tier-1 cryptocurrency derivative exchanges deploy sophisticated multi-tiered risk mitigation protocols to prevent market insolvency during black swan cascades. The first line of defense is the tiered maintenance margin schedule, which progressively escalates required collateral as position sizes increase. This policy prevents single whale accounts from monopolizing scarce market liquidity during sudden volatility bursts.
When an account's equity falls below maintenance margin, the exchange attempts to liquidate the position before its net equity reaches zero (the bankruptcy price). If adverse slippage causes execution to occur below the bankruptcy price, the deficit is absorbed by the exchange's dedicated Insurance Fund. The combined insurance reserves of Binance, Bybit, and OKX currently exceed $1.85B, providing substantial resilience against systemic contagion.
Only when an insurance fund suffers catastrophic depletion during unprecedented market freezes does the exchange activate Auto-Deleveraging (ADL). Under ADL protocols, opposing profitable high-leverage positions are automatically closed out at the bankruptcy price of the liquidated accounts. By tracking liquidation cascade velocity against real-time book depth, institutional participants can accurately position ahead of cascade termination points and avoid being caught on the wrong side of forced deleveraging flushes.
Access Real-Time Terminal Intelligence & Quantitative Signals
Unlock instant Telegram alerts, full congressional portfolio archives, and algorithmic catalyst radar.
Upgrade to Gemral Edge Pro ($39/mo)Frequently asked questions
What is a cryptocurrency liquidation cascade and how does it start?
A liquidation cascade occurs when falling prices trigger the automatic forced closing of leveraged long positions across derivative exchanges. As each account is liquidated via aggressive market sell orders, the resulting downward price shock pushes the next tier of leveraged traders below their maintenance margins, creating a self-reinforcing downward spiral of forced selling.
How does orderbook depth limit or amplify cascade price drops?
Orderbook depth represents the cumulative volume of limit buy orders waiting at various price tiers. When forced liquidation volume exceeds the visible depth within ±2% of spot, market orders slice through the bid ladder into empty space, causing severe nonlinear price slippage and amplifying the downward price shock.
What is the difference between normal execution slippage and cascade slippage?
Normal execution slippage scales linearly with order size in orderly markets. During a liquidation cascade, slippage becomes highly convex (power law exponent ~1.45) because liquidity providers rapidly cancel resting bids to avoid adverse selection, forcing liquidations into illiquid air pockets.
Why do massive liquidation cascades frequently produce V-shape recovery wicks?
Because liquidation cascades are driven entirely by artificial, non-fundamental forced selling. The moment the pool of leveraged positions at that price tier is completely wiped out, the selling volume instantly drops to zero. Arbitrageurs, market makers, and dip buyers then step in to buy deeply discounted assets against heavily negative funding rates, driving a rapid price snapback.
How do exchange insurance funds prevent Auto-Deleveraging (ADL)?
Exchange insurance funds absorb negative account balances when a position is liquidated at a price worse than its bankruptcy price. As long as the insurance fund has sufficient capital, profitable traders remain unaffected. ADL is only triggered if the insurance fund is completely exhausted during extreme market dislocations.
What mathematical formula does this tool use to estimate price shock?
The tool uses Kyle's lambda market microstructure model combined with a nonlinear depth deficit power function: Slippage % = 0.55 * (Liquidation Volume / Orderbook Depth)^1.45, with a leverage feedback multiplier that adjusts price drop based on market-wide leverage compression.
How can professional traders utilize this calculator for trade positioning?
Institutional traders use this tool to calculate expected trough prices and exhaustion wicks during market panics. By identifying where forced selling is mathematically projected to deplete orderbook depth, traders can place limit buy orders precisely at high-probability reversal zones to capture violent post-flush mean-reversion bounces.
Risk Disclaimer
Trading and investing in digital assets, financial instruments, and predictive events involve substantial risk of loss and are not suitable for every investor. The predictive intelligence, probability distributions, historical precedents, and scenario modeling presented on this page are compiled for informational and research purposes only and do not constitute financial, investment, legal, or tax advice. Past performance and statistical precedents do not guarantee future outcomes. Always conduct independent due diligence before committing capital.