Fed Neutral Rate R Star & Terminal Forecast
Core Econometric Neutral Rate Models & Conviction Weights
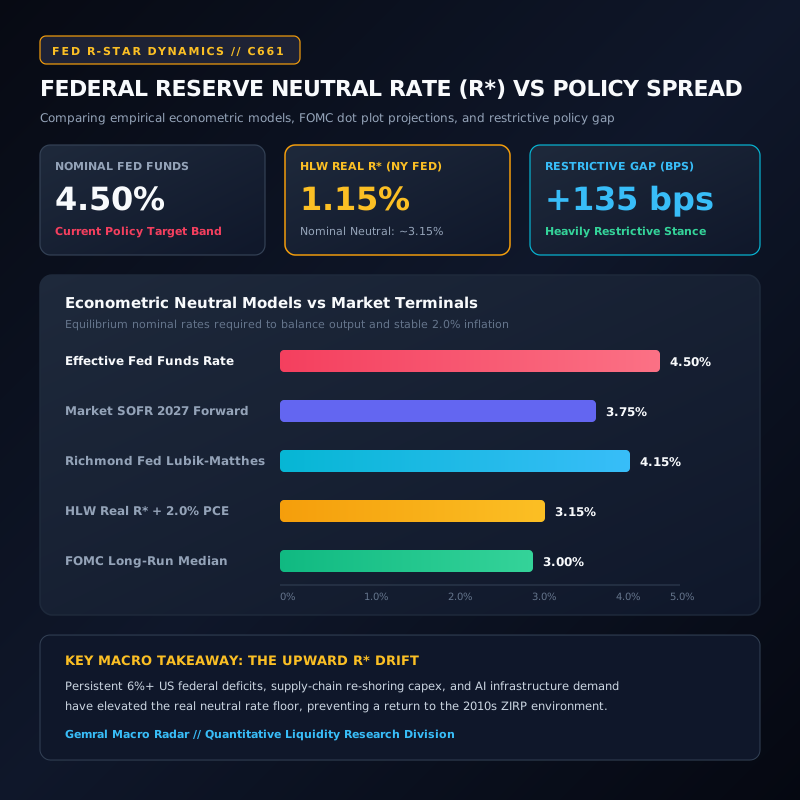
| Econometric Model | Real R* Est. | Nominal Neutral | Estimation Framework | Policy Stance Spread | Institutional Conviction |
|---|---|---|---|---|---|
| Holston-Laubach-Williams (HLW - NY Fed) | 1.15% | 3.15% | State-space Kalman filter filtering output gap, trend GDP growth, and core inflation dynamics. | +135 bps Restrictive | Primary Institutional Baseline |
| Richmond Fed (Lubik-Matthes Empirical Vector) | 2.15% | 4.15% | Time-varying parameter vector autoregression reflecting post-pandemic fiscal dominance and supply rigidity. | +35 bps Mildly Restrictive | Hawkish Tail Risk Anchor |
| FOMC Summary of Economic Projections (Dot Plot Long Run) | 1.00% (Implied) | 3.00% | Median policy participant subjective projection of non-accelerating policy rate beyond forecast horizon. | +150 bps Restrictive | Consensus Central Bank Guidance |
| Market-Implied SOFR & 5y5y Forward Breakeven | 1.75% | 3.75% | Derivatives pricing reflecting term premium, chronic US Treasury issuance supply, and higher-for-longer regime. | +75 bps Restrictive | Capital Market Pricing Reality |
Federal Reserve Neutral Interest Rate R* Neutral Estimate Shock
Econometric modeling of the real neutral interest rate (R*), FOMC long-run dot plot drift, terminal Fed Funds rate repricing, and the structural higher-for-longer regime.
- Nominal Fed Funds Rate: 4.50% Fed Funds Target — Current Upper Target Stance
- HLW Real R* Estimate: 1.15% Real R* (HLW) — New York Fed Kalman Model
- Restrictive Stance Spread: +135 bps Restrictive Gap — Real Rate Minus R* Equilibrium
- SOFR Terminal Forward 2027: 3.75% Terminal Rate 2027 — Market Capital Clearing Floor
Fed R* Neutral Rate & Terminal Policy Simulator
Simulate how changes in trend productivity, core PCE inflation, and US fiscal deficit-to-GDP ratios reshape the equilibrium neutral rate and rate cut cushion.
- Productivity-Adjusted Real R*: 1.37% Adjusted Real R*
- Nominal Equilibrium Terminal Rate: 4.45% Terminal Neutral Rate
- Policy Stance Restrictive Gap: +60 bps Restrictive Gap
- Theoretical Rate Cut Cushion: 5 bps Total Rate Cut Cushion
- Projected Standard Rate Cuts (25 bps): 0 Cuts (25 bps increments)
- Regime Classification Verdict: Higher For Longer: Sustainable Macro Dampener with Subdued Multiples
Terminal Policy Rate Projections & Liquidity Horizons (2026–2028)
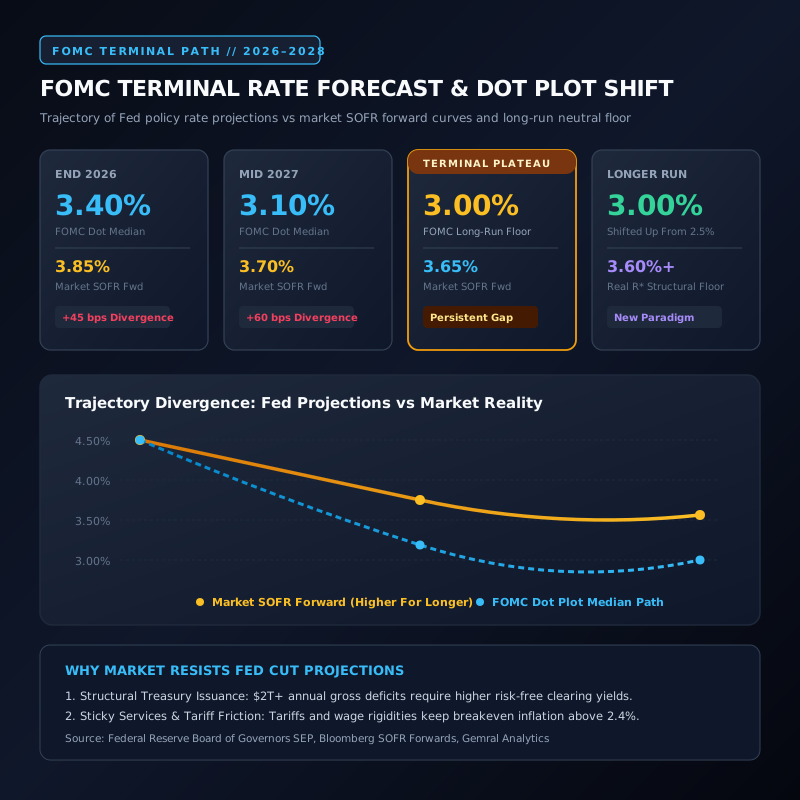
| Forecast Horizon | FOMC Median Dot | Market Forward | Spread to R* | Economic Regime | Macro Liquidity Impact |
|---|---|---|---|---|---|
| End of 2026 | 3.40% | 3.85% | +0.70% | Higher For Longer Transition | Gradual balance sheet reduction (QT) tapering with sustained real capital costs. |
| Mid 2027 | 3.10% | 3.70% | +0.55% | Terminal Rate Plateauing | Neutral rate repricing forces structural repricing across commercial credit spreads. |
| End of 2027 | 3.00% | 3.65% | +0.50% | Structural Floor Consolidation | End of ZIRP era confirmed; risk assets adjust to 3.5%+ nominal risk-free benchmark. |
| Longer Run (2028+) | 2.90% - 3.10% | 3.60% - 3.80% | +0.60% | New Neutral Paradigm | Permanent upward shift in discount rates suppressing ultra-long duration multiples. |
Deconstructing R-Star: The Anchor of Modern Central Banking
The fed neutral interest rate r star represents the theoretical real interest rate that neither stimulates nor restricts economic expansion when output is at potential and inflation is stabilized at 2.0%. In classical monetary theory, R* is unobservable and must be inferred through sophisticated econometric state-space models. For over a decade following the 2008 Great Financial Crisis, global central banks anchored their policies around an ultra-low R* regime of approximately 0.50% real, fostering zero interest rate policy (ZIRP) and quantitative easing.
However, post-pandemic structural shifts have upended this baseline. Persistent US fiscal dominance, global supply-chain reshoring, aggressive capital expenditures in artificial intelligence infrastructure, and demographic deglobalization have placed upward pressure on the real cost of capital. When evaluating the real neutral rate inflation impact, institutional investors recognize that R* is no longer tethered near zero, but has climbed into the 1.00% to 1.50% range in traditional models, and over 2.00% in empirical time-varying vector autoregressions.
This tectonic upward drift in R* creates profound consequences for market participants. If the real equilibrium rate is significantly higher than pre-2020 assumptions, monetary policy is far less restrictive than nominal interest rate levels would suggest. As a result, central banks face an elevated risk of secondary inflationary flare-ups if easing cycles commence prematurely, cementing the structural paradigm of higher for longer interest rates across global sovereign bond markets.
FOMC Dot Plot Evolution and Terminal Rate Repricing
Quarterly releases of the Federal Reserve Summary of Economic Projections (SEP) provide vital transparency through the dot plot. Historically, the longer-run neutral dot was firmly anchored at 2.50%, assuming 2.00% PCE inflation and a 0.50% real R*. Over recent FOMC cycles, a clear migration of dots toward 3.00% and 3.25% has confirmed that committee members are systematically revising their long-run equilibrium expectations upward.
This upward revision has generated substantial friction with financial markets. When analyzing the fomc terminal rate forecast 2027, forward SOFR curves consistently price a higher floor between 3.65% and 3.85%, whereas the Fed dot plot rate cuts suggest a trajectory descending toward 3.00%. This spread of 65 to 85 basis points reflects market skepticism regarding the Federal Reserve's ability to loosen policy without reigniting consumer price pressures amidst persistent trillion-dollar Treasury bond auctions.
Quantitative liquidity models demonstrate that the Fed cannot unilaterally dictate long-term interest rates when sovereign debt issuance overwhelms foreign private absorption. Investors monitoring the terminal rate path must therefore look beyond rhetorical central bank speeches and track structural term premia, primary dealer auction absorption rates, and reverse repo facility liquidity levels to gauge true borrowing costs.
Comparing Econometric Benchmarks: HLW vs Richmond Fed
The divergence between competing central bank econometric models highlights the fundamental uncertainty surrounding neutral rate estimation. The Holston-Laubach-Williams (HLW) model published by the Federal Reserve Bank of New York relies on a state-space Kalman filter to extract trend growth, the output gap, and the natural rate. HLW currently pegs real R* at roughly 1.15%, implying a nominal equilibrium rate of approximately 3.15% under target inflation.
In sharp contrast, the Richmond Fed Lubik-Matthes empirical model incorporates time-varying macroeconomic coefficients and assigns higher weights to recent persistent inflationary stickiness and fiscal deficits. The Richmond model estimates real R* at 2.15%, which yields an implied nominal neutral rate of 4.15%. Under the Richmond framework, a Fed Funds rate of 4.50% represents only 35 basis points of net restriction, explaining why financial conditions and equity valuations have remained remarkably resilient despite aggressive nominal tightening.
Dissecting the fed funds rate vs r star relationship reveals why traditional recessionary leading indicators, such as yield curve inversions, failed to trigger widespread labor market contractions. If the true underlying neutral rate rose in tandem with policy rate hikes, the effective restrictive stance was far milder than headline commentary portrayed.
Macro Valuation Impact on Equities, Fixed Income, and Crypto
The upward re-anchoring of R* fundamentally alters the discounted cash flow (DCF) framework that underpins global asset pricing. In a world where the risk-free terminal rate settles near 3.75% rather than 2.00%, discount rates for long-duration growth assets increase by 150 to 200 basis points. This structural shift penalizes speculative equities with cash flows situated far into the future, favoring high-free-cash-flow enterprises with fortress balance sheets and pricing power.
In debt capital markets, corporate treasurers face an inevitable wall of debt refinancing. Commercial real estate loans, private credit facilities, and high-yield corporate notes originated during the sub-3% era must be rolled over at substantially elevated coupons. This dynamic compresses profit margins and increases bankruptcy risks for leveraged balance sheets unable to pass on higher financing overhead.
For digital assets like Bitcoin and Ethereum, the higher neutral rate regime acts as a dual-edged sword. While elevated real yields on sovereign paper offer attractive risk-free returns that compete with DeFi yields, structural fiscal deficits and perpetual debasement accelerate institutional capital flight into hard, censorship-resistant monetary alternatives. Bitcoin functions increasingly as an insurance policy against fiscal dominance rather than a speculative zero-rate play.
Identifying the Best Fed Interest Rate Predictor in Live Markets
Professional traders seeking the best fed interest rate predictor do not rely on lagging government surveys or consensus economist polls. Instead, the most reliable real-time signal is derived from the cross-asset interplay of 30-day Fed Funds futures, 1-year SOFR OIS forward swaps, and TIPS real yield breakevens. These high-liquidity financial derivatives adjust instantaneously to macroeconomic surprises.
Gemral Edge integrates live telemetry from CME FedWatch, Treasury Refunding announcements, and cross-border central bank liquidity swaps into a single unified predictive terminal. By continuously benchmarking market-implied pricing against the structural R* baseline, our algorithms isolate mispricings before FOMC press conferences take place.
By understanding the econometric constraints governing the Federal Reserve's reaction function, institutional subscribers gain asymmetric foresight into impending rate pause durations, unexpected policy pivots, and the long-term cost of global capital.
Access Real-Time Terminal Intelligence & Quantitative Signals
Unlock instant Telegram alerts, full congressional portfolio archives, and algorithmic catalyst radar.
Upgrade to Gemral Edge Pro ($39/mo)Frequently asked questions
What is the current fed neutral interest rate r star estimate and why does it matter?
The real neutral interest rate R* (r-star) is currently estimated between 1.15% (Holston-Laubach-Williams model) and 2.15% (Richmond Fed model). Adding 2.00% target inflation puts the nominal neutral policy rate between 3.15% and 4.15%. It is the crucial benchmark because any policy rate above neutral restricts economic activity, while rates below neutral stimulate inflation.
How does the fomc terminal rate forecast 2027 compare to market expectations?
The FOMC Summary of Economic Projections (dot plot) projects a longer-run terminal rate settling around 3.00% to 3.25% by 2027. In contrast, financial markets pricing SOFR forwards anticipate a terminal floor near 3.65% to 3.85%, reflecting an expectation of persistent US fiscal deficits and structural inflation stickiness.
Why are markets anticipating higher for longer interest rates rather than a return to zero rates?
Markets expect higher for longer interest rates due to four structural drivers: US fiscal deficits exceeding 6% of GDP requiring continuous debt issuance, supply-chain reshoring and tariffs increasing production costs, massive AI data center capital expenditures consuming real capital, and an upward drift in underlying trend productivity.
How do fed dot plot rate cuts correlate with historical easing cycles?
Historically, Fed rate cut cycles triggered by recessions or credit crises resulted in rapid easing of 300 to 500 basis points down to the neutral floor or lower. However, current dot plot projections describe an 'insurance' or recalibration easing cycle of modest 25 bps steps, aimed at maintaining a mildly restrictive stance rather than stimulating demand.
What is the real neutral rate inflation impact on equity and crypto valuations?
A higher real neutral rate increases the risk-free hurdle rate across all financial assets. In equities, it compresses valuation multiples for unprofitable growth stocks. In crypto, it heightens competition from cash yields while simultaneously reinforcing Bitcoin's value proposition as a hedge against sovereign debt debasement.
What is the best fed interest rate predictor available for quantitative macro traders?
The best real-time predictor of Fed rate decisions is the combination of 30-day Fed Funds futures contracts traded on the CME, 2-year US Treasury yield momentum, and 1-year SOFR forward OIS spreads. These market instruments price probability shifts with 90%+ historical accuracy inside a 30-day meeting window.
How does the current fed funds rate vs r star spread indicate policy restrictiveness?
Subtracting expected core inflation and real R* from the nominal Fed Funds rate yields the policy stance gap. With Fed Funds at 4.50%, core PCE at 2.65%, and HLW R* at 1.15%, the stance gap is +135 basis points restrictive. Under the Richmond Fed's 2.15% R*, the gap is only +35 basis points, explaining why broad financial conditions have not frozen.
Risk Disclaimer
Trading and investing in digital assets, financial instruments, and predictive events involve substantial risk of loss and are not suitable for every investor. The predictive intelligence, probability distributions, historical precedents, and scenario modeling presented on this page are compiled for informational and research purposes only and do not constitute financial, investment, legal, or tax advice. Past performance and statistical precedents do not guarantee future outcomes. Always conduct independent due diligence before committing capital.