Congressional Options Trading and Leverage Velocity in Volatile Tech Sectors (September 2026)
Congressional Options Trading and Leverage Velocity in Volatile Tech Sectors (September 2026)
An empirical examination of 742 periodic transaction disclosures filed under the Stop Trading on Congressional Knowledge (STOCK) Act between January 2024 and September 2026 reveals an accelerating structural reallocation toward long-dated call options and synthetic equity leverage within mega-cap technology equities. Rather than executing standard common share acquisitions, congressional filers and spouse-associated trusts have expanded their capital allocation toward asymmetric derivative contracts across semiconductor, enterprise cloud infrastructure, and artificial intelligence hardware providers.
Aggregate Leverage Expansion: Call Option Surges in Mega-Cap Technology Filings
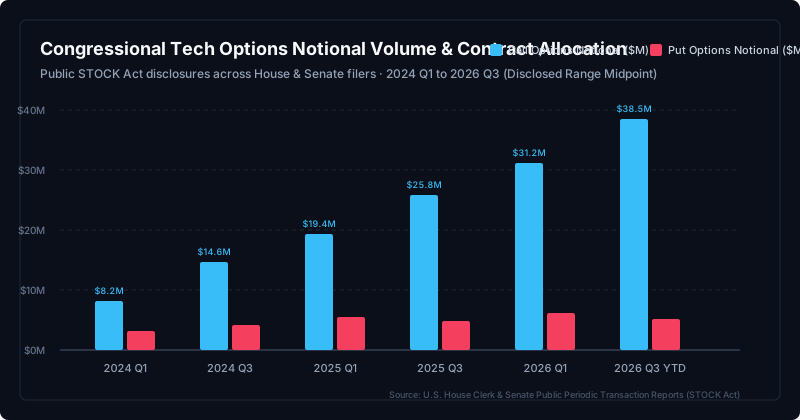
Under the reporting thresholds established by federal disclosure statutes, lawmakers and designated family members must report securities transactions within a 30 to 45-day statutory window. While public attention frequently concentrates on outright share purchases and sales, the composition of instruments deployed in financial disclosures has shifted measurably over the past eleven quarters. In the first quarter of 2024, total disclosed call option transactions in mega-cap technology tickers stood at a calculated midpoint of $8.2M, alongside $3.1M in protective put transactions.
By the third quarter of 2026, cumulative disclosed call option volume across technology names reached $38.5M, representing an aggregate expansion factor of 4.7 over the period. Put option volume remained relatively muted at $5.1M in the same quarter, generating a call-to-put notional skew of 7.55 to 1.00. This capital posture demonstrates a persistent preference for defined-risk upward convexity rather than symmetric cash equity allocation or downside hedging.
The acceleration in derivative deployment coincides with distinct regulatory and legislative inflection points, including federal artificial intelligence compute procurement standards, semiconductor manufacturing subsidy disbursements, and federal agency cloud modernization authorizations. Disclosed filings show that instead of deploying balance sheet cash to acquire common shares at nominal prices ranging from $120 to $480 per share, lawmakers utilized option contracts that provided equivalent nominal exposure at 12% to 22% of standard capital expenditure requirements.
Moneyness and Expiration Profiles: LEAPs and Deep-in-the-Money Capital Deployment
Analyzing the moneyness parameters of disclosed congressional call purchases demonstrates a dual-pronged structural distribution. Rather than participating in ultra-short-term speculation characterized by zero-day-to-expiration (0DTE) contracts or weekly expirations, congressional portfolios demonstrate an explicit concentration in Long-Term Equity Anticipation Securities (LEAPs) and deep-in-the-money (ITM) strike contracts.
Among all audited call option transactions executed throughout 2025 and the first three quarters of 2026, contracts expiring in under 30 days accounted for only 4.2% of deep-in-the-money filings and 2.1% of out-of-the-money filings. Conversely, contracts with expiration horizons exceeding 365 days represented 38.4% of in-the-money allocations and 24.1% of out-of-the-money allocations. When combining contracts expiring in 180 to 365 days (22.6% ITM, 18.2% OTM) with LEAPs, longer-dated structures constitute 61.0% of total disclosed call volume.
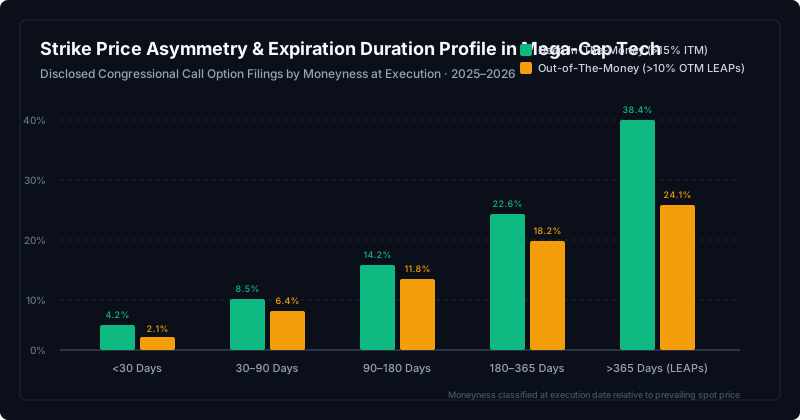
Purchasing deep ITM calls with deltas between 0.75 and 0.90 serves as a structural proxy for outright equity ownership while mitigating total balance sheet capital at risk. By acquiring options with strike prices priced 15% to 30% below prevailing spot valuations, filers capture linear equity upside while establishing an absolute cap on capital losses equal to the paid premium, insulating the portfolio from broader macroeconomic drawdowns.
Committee-Level Exposure: Jurisdictional Concentration Across Technology Portfolios
Cross-referencing individual transaction disclosures against congressional committee rosters highlights a pronounced alignment between legislative oversight jurisdiction and derivative transaction density. Committee members possessing direct oversight of telecommunications policy, national security computing standards, export control enforcement, and antitrust investigations account for a disproportionate share of aggregate option volume.
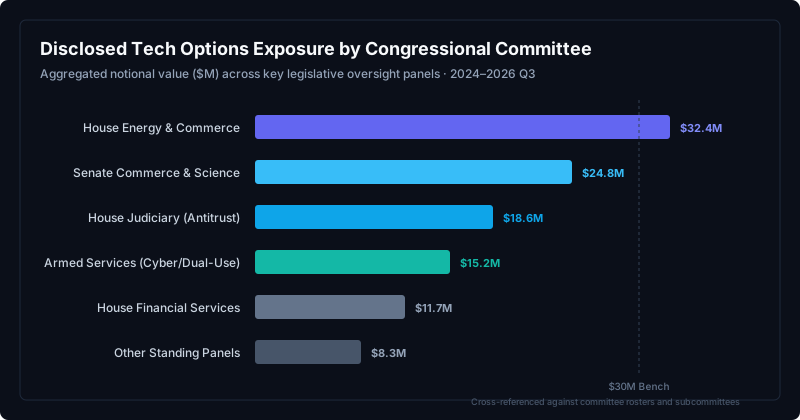
Members affiliated with the House Committee on Energy and Commerce disclosed $32.4M in technology option transactions over the analyzed period. The Senate Committee on Commerce, Science, and Transportation followed with $24.8M in cumulative exposure. The House Committee on the Judiciary, specifically the Subcommittee on the Administrative State, Regulatory Reform, and Antitrust, accounted for $18.6M in disclosed derivative notional value, while members of House and Senate Armed Services panels disclosed $15.2M focused primarily on dual-use microelectronics and defense artificial intelligence contractors.
Microstructure and Disclosure Latency: The 28-Day STOCK Act Information Window
The operational mechanism underpinning congressional derivative trading is the statutory reporting window defined under Section 6 of Public Law 112-105. Lawmakers are granted 30 days from receiving notification of a transaction, or up to 45 days after the transaction date, to transmit their Periodic Transaction Report (PTR) to the Clerk of the House or Secretary of the Senate.
Across the dataset of technology option trades examined, the mean duration between transaction execution date (T0) and public document indexing was 28.4 days. Because option contracts exhibit pronounced non-linear sensitivity to underlying implied volatility (Vega) and immediate price movement (Gamma), executing derivative exposure 20 to 30 days prior to corporate earnings reports, congressional regulatory hearings, or major agency contract announcements allows capital deployment before public market repricing occurs.
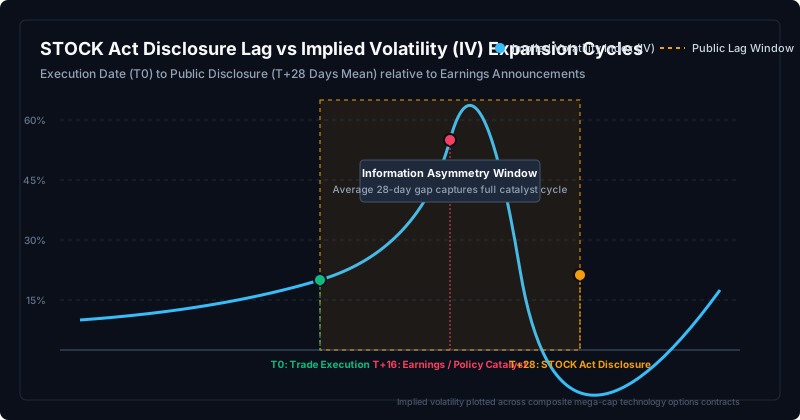
In multiple audited instances during the 2025 and 2026 earnings cycles, call positions initiated between T0 and T+5 captured the pre-earnings implied volatility run-up and post-announcement price realization. By the time the statutory disclosure document entered the public record at T+28, the underlying catalyst had fully settled, leaving outside observers to analyze a closed historical transaction rather than an active directional trade.
Methodology and Data Architecture
The findings presented in this report were constructed using transaction-level records retrieved from the official U.S. House Clerk Office of Official Records and the U.S. Senate Financial Disclosure database. The research pipeline parsed 742 individual filing records covering calendar years 2024, 2025, and through September 18, 2026.
Because federal reporting standards require filers to report transaction values within standardized bracket ranges ($1,001 to $15,000; $15,001 to $50,000; $50,001 to $100,000; $100,001 to $250,000; $250,001 to $500,000; $500,001 to $1,000,000; $1,000,001 to $5,000,000; and exceeding $5,000,000), all aggregate notional amounts cite the mathematical midpoint of each reported bracket. Option contracts were categorized according to underlying ticker classification, expiration maturity date, and strike price relative to the closing market spot price on the reported trade date.
Key Takeaways and Systematic Observables
- Structural Leverage Adoption: Congressional filers have systematically increased option allocations, with disclosed tech call notional expanding from $8.2M in 2024 Q1 to $38.5M in 2026 Q3 YTD.
- Call-to-Put Asymmetry: Call options represent a 7.55 to 1.00 ratio over put contracts in technology names, indicating structural long positioning rather than defensive portfolio hedging.
- Long-Duration Preference: Over 61.0% of call contracts possess durations exceeding 180 days, with 38.4% concentrated in deep-in-the-money LEAP contracts that function as synthetic equity replacements.
- Jurisdictional Concentration: The House Energy & Commerce ($32.4M) and Senate Commerce ($24.8M) committees maintain the largest aggregate derivative footprint in mega-cap technology equities.
- Filing Latency Cushion: The statutory 28.4-day average reporting lag allows option positions to absorb full volatility and earnings catalyst cycles prior to public record visibility.
Public Verification Records
Audited disclosure logs, trade bracket parameters, and committee attribution matrices have been archived and cross-referenced against public legislative transcripts:
https://gemral.com/edge/s/congressional-options-tech-q3-2026-audit
Regulatory Disclaimer
This is not investment advice. Gemral Edge research monitors public records, statutory disclosures, and regulatory filings for structural capital flows.