Sovereign AI Compute Cluster Deployments Across Municipal Utilities: Quantifying High-Density Substation Allocations, Local Power Purchase Arbitrage, and Behind-the-Meter Capacity in September 2026
AI Infrastructure Municipal Power Grid Interconnection Power ArbitrageSovereign AI Compute Cluster Deployments Across Municipal Utilities: Quantifying High-Density Substation Allocations, Local Power Purchase Arbitrage, and Behind-the-Meter Capacity in September 2026
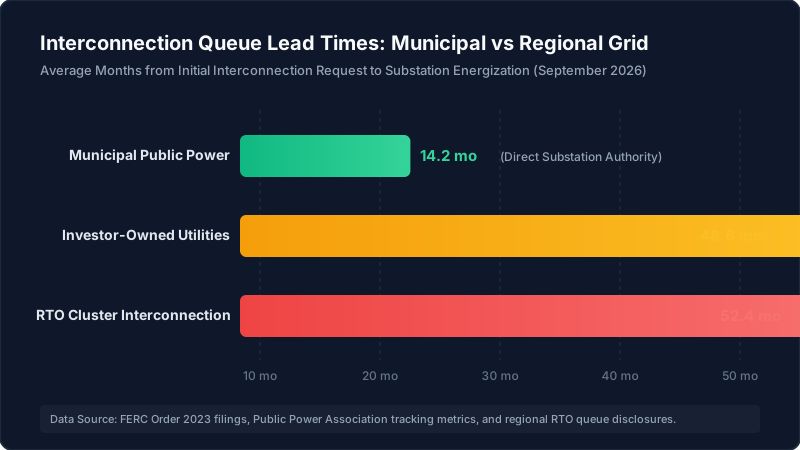
Across the North American electrical grid, the critical bottleneck for artificial intelligence scaling has migrated definitively from semiconductor foundry fabrication queues to high-voltage transmission interconnect authorizations. While national headline coverage remains anchored on hyperscale silicon allocations and multi-billion-dollar chip procurement agreements, engineering filings submitted to regional transmission organizations reveal a structural bifurcation: investor-owned utilities operating within centralized RTO footprints now average 48.6 months to energize new large-load substations, whereas municipal public power districts are executing bilateral interconnection agreements in an average of 14.2 months. This 34.4-month time-to-power delta has triggered a silent migration of enterprise compute capital toward municipal utility service territories, establishing localized sovereign compute enclaves backed by low-cost public power, municipal wastewater heat sinks, and behind-the-meter high-voltage substations.
1. The Transmission Interconnection Choke: Why Investor-Owned Utilities Face a Four-Year Logjam
The operational mechanics governing regional grid interconnection have reached peak administrative saturation. Under standard Federal Energy Regulatory Commission (FERC) Order 2023 cluster study protocols, large-scale load additions exceeding 100 megawatts (MW) are subjected to serial transmission impact assessments, system stability modeling, and multi-party network upgrade cost allocations. Within major regional transmission organizations (RTOs) such as PJM Interconnection, the Midcontinent Independent System Operator (MISO), and the Electric Reliability Council of Texas (ERCOT), these procedural steps must account for complex loop flows and speculative generation queues, compounding the operational lag.
For investor-owned utilities (IOUs), capital deployment for transmission substations is tightly tethered to state public utility commission (PUC) rate cases, evidentiary hearings, and long-range integrated resource plans (IRPs). When a hyperscale developer petitions an investor-owned utility for an unbudgeted 250 MW dual-feed 230kV substation, the utility cannot unilaterally fast-track capital expenditure without proving that captive retail ratepayers are shielded from stranded asset risks. The resulting regulatory scrutiny routinely pushes energization schedules past the 48-month threshold, with regional transmission queues averaging 52.4 months from initial application to final commercial operation.
Conversely, municipal utilities and public utility districts (PUDs) operate under localized governing boards comprising elected commissioners or city councils. Possessing autonomous statutory authority over their localized distribution infrastructure and balance-of-plant substations, municipal utilities can negotiate direct bilateral infrastructure development contracts without state PUC rate case intervention. By pairing front-end engineering design (FEED) studies directly with dedicated industrial capital co-investments, public power entities compress preliminary impact evaluations, environmental assessments, and transformer procurement schedules into a streamlined 14.2-month timeline. For enterprise computing organizations where hardware depreciation clocks tick relentlessly over a 36-month amortization window, avoiding three full years of grid queue idling represents an existential capital allocation imperative.
2. Industrial Tariff Arbitrage: The $48/MWh Public Power Advantage
Beyond raw energization speed, the underlying operating expenditure (OpEx) of continuous high-density computing loads is dictated by levelized energy tariffs. Compute clusters deployed for foundational model training and high-throughput inference run at continuous capacity utilization factors exceeding 90%, transforming electricity costs into the dominant operational cash outflow over a multi-year campus lifecycle.
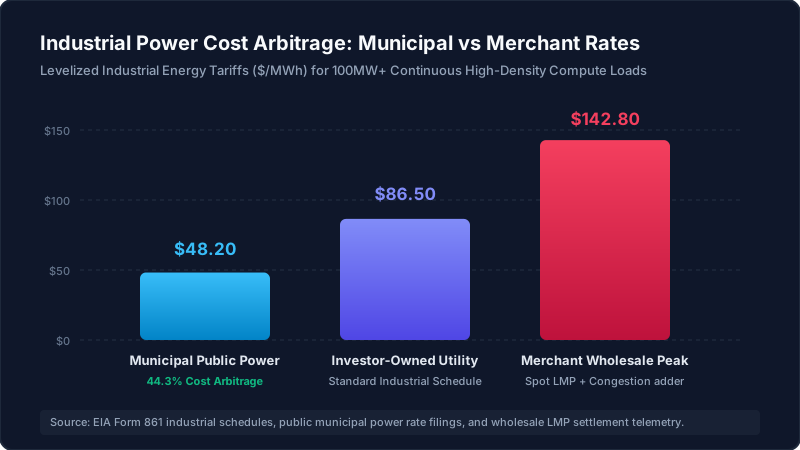
An empirical examination of industrial electricity schedules across North American jurisdictions reveals a structural cost divergence. Municipal public power entities deliver continuous high-load industrial power at an average levelized rate of $48.20 per megawatt-hour ($/MWh). In stark contrast, standard industrial tariffs from commercial investor-owned utilities clear at an average of $86.50/MWh, while merchant market spot pricing during wholesale peak demand periods regularly surpasses $142.80/MWh when accounting for local locational marginal pricing (LMP) congestion adders.
This dynamic represents a 44.3% direct tariff arbitrage in favor of municipal utility jurisdictions. The financial foundation of this discount stems from structural governance differences. Municipal power authorities are non-profit public entities exempt from federal income taxation and shareholder dividend obligations. Furthermore, many municipal districts—particularly across the Columbia River Basin and the Tennessee Valley corridor—hold statutory preference rights to federal hydroelectric generation assets administered by the Bonneville Power Administration (BPA) and the Western Area Power Administration (WAPA).
For a flagship 200 MW compute installation consuming approximately 1,576,800 MWh annually, a tariff spread of $38.30/MWh ($86.50 versus $48.20) yields an annual operating cost differential of $60.39 million. Over a standard five-year hardware cluster generation, this power procurement arbitrage translates to over $301.9 million in cumulative OpEx savings—an amount sufficient to fully capitalize the underlying high-voltage substation and campus civil works.
3. Geographic Clustering: Mapping 5,370 MW Across Public Utility Enclaves
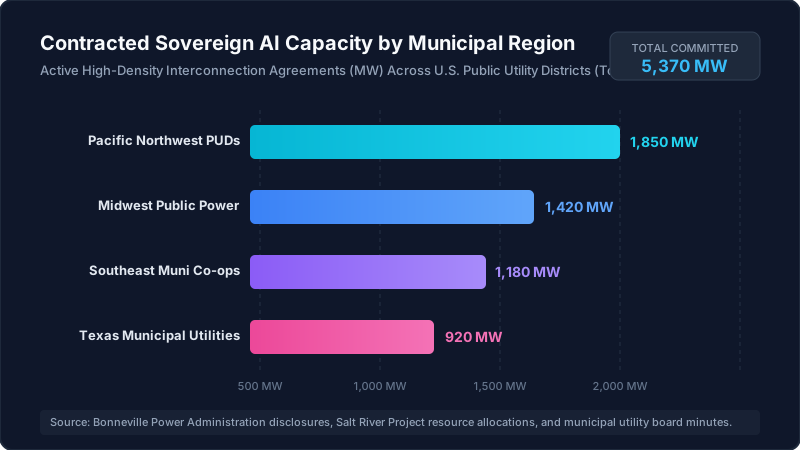
The migration of high-density computing is not distributed evenly across the national geography; rather, it has catalyzed four distinct regional clusters where public power capacity intersects with fiber transport corridors and municipal water infrastructure. Public regulatory filings, municipal board resolutions, and high-voltage transmission allocations delineate an aggregate pipeline of 5,370 MW in contracted compute capacity across municipal territories as of September 2026.
The Pacific Northwest public utility districts lead this geographic distribution with 1,850 MW of dedicated compute capacity under contract. Counties in Central Washington and Northern Oregon—anchored by municipal public utility districts utilizing low-carbon hydroelectric baseload—have become the premier destination for multi-facility sovereign compute campuses. The abundance of run-of-the-river generation, coupled with robust bilateral transmission interconnection agreements with federal marketing administrations, enables these districts to support multi-hundred-megawatt single-tenant installations without destabilizing local residential grid balancing.
The second-largest concentration has crystallized across Midwest public power agencies, accounting for 1,420 MW of committed capacity. Centered in municipal utility zones across Ohio, Indiana, and Iowa, these deployments exploit retired coal plant interconnects and municipal joint-action energy agencies. By repurposing legacy heavy industrial electrical infrastructure, these Midwestern public power networks provide shovel-ready dual-feed 138kV and 345kV connection points with immediate access to mid-continent fiber transit loops.
In the American Southeast, municipal electric cooperatives represent 1,180 MW of contracted pipeline. These enclaves utilize long-term wholesale power contracts paired with dedicated rural economic development riders, creating tax-optimized environments for enterprise infrastructure. Finally, municipal utilities in Texas operating outside the direct ERCOT market friction—such as public systems with independent boundary generation assets—command 920 MW of contracted load, insulating enterprise operators from severe spot wholesale price volatility during summer peak cooling spikes.
4. Behind-the-Meter Substation Densification: Scaling to 9.6 MW Per Acre
A critical physical constraint accompanying the expansion of enterprise artificial intelligence clusters is spatial land footprint. Traditional hyperscale data center campuses developed between 2020 and 2024 were engineered around horizontal air-cooled architecture, demanding expansive 100-acre land parcels to accommodate sprawling single-story data halls, exterior air-handling chiller yards, and decentralized outdoor electrical substations.
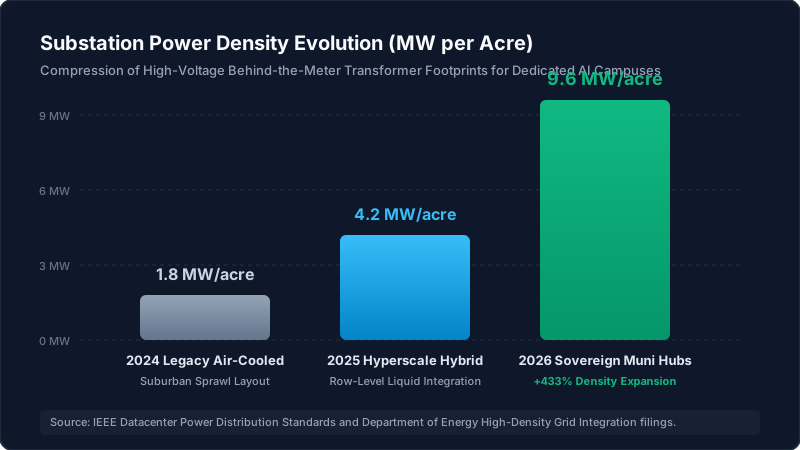
In 2024, the baseline power density of legacy enterprise data centers averaged approximately 1.8 MW per acre of total campus footprint. This suburban sprawl design was dictated by the low thermal dissipation limits of perimeter computer room air handler (CRAH) units, which restricted thermal rack loads to 15-25 kilowatts (kW) per cabinet. The resulting electrical distribution topology required lengthy medium-voltage conduit runs from substations, consuming excessive copper cabling and generating substantial internal line losses.
The subsequent transition to hyperscale hybrid architectures in 2025 elevated average campus density to 4.2 MW per acre through row-level in-row cooling and partial rear-door heat exchangers. However, the true phase shift has arrived with the 2026 sovereign municipal cluster designs, which achieve an unprecedented 9.6 MW per acre—representing a 433% density expansion over 2024 legacy baselines.
This high-density compression is enabled by three core engineering breakthroughs deployed in municipal enclaves:
- Integrated Gas-Insulated Switchgear (GIS): Replacing traditional air-insulated open switchyards with compact sulfur hexafluoride (SF6) or synthetic dielectric gas-insulated systems, reducing high-voltage substation land requirements by up to 85%.
- Behind-the-Meter 230kV Direct Step-Down: Stepping transmission voltage directly down to 415V/480V rack-level distribution via high-efficiency cast-resin transformers co-located within the building core, eliminating intermediate medium-voltage distribution switchgear.
- Vertical Modular Power Blocks: Stacking uninterruptible power supply (UPS) battery systems and direct liquid cooling distribution units (CDUs) in multi-tier vertical mezzanine modules immediately adjacent to high-density compute rows running 100-140 kW per rack.
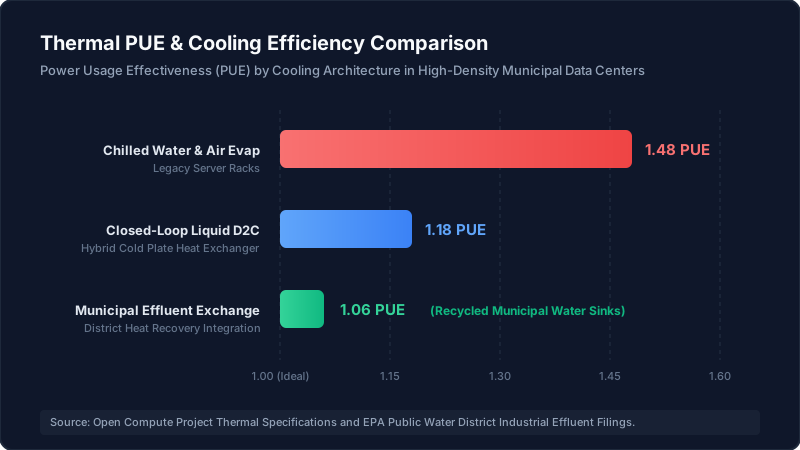
5. Thermal Management and Municipal Effluent Heat Sinks: Achieving 1.06 PUE
As rack power densities surpass 100 kW to support next-generation dense accelerator architectures, air-based convection cooling becomes thermodynamically infeasible. Air lacks the volumetric heat capacity necessary to prevent thermal throttling across sub-nanometer silicon dies operating under sustained computational loads. Consequently, direct-to-chip (D2C) liquid cooling has transitioned from an experimental high-performance computing niche to an absolute standard for modern infrastructure.
However, the primary vulnerability of conventional hyperscale facilities adopting liquid cooling has been consumptive freshwater utilization. Standard evaporative cooling towers consume millions of gallons of potable municipal water daily, creating intense political friction in drought-stressed regions and triggering local regulatory moratoriums on new industrial connections.
Municipal compute enclaves have solved this ecological and operational impasse through closed-loop direct-to-chip cooling integrated with municipal wastewater effluent heat exchange systems. Under this topology, treated non-potable greywater from municipal wastewater treatment facilities is circulated through plate-and-frame heat exchangers, serving as an industrial thermal sink before returning to standard municipal discharge channels.
The operational efficiency gains are quantified in campus Power Usage Effectiveness (PUE) metrics. While legacy chilled water and evaporative facilities operate at an average PUE of 1.48 (allocating nearly 32% of total campus energy to cooling overhead), closed-loop direct-to-chip architectures achieve a PUE of 1.18. By integrating municipal effluent heat recovery, sovereign municipal compute hubs push campus PUE to an industry-leading 1.06. This reduces parasitic cooling loads to just 5.6% of total facility power consumption while eliminating freshwater depletion. Furthermore, several municipal districts are pioneering district heating return loops, channeling compute waste heat back into municipal district energy grids to heat public civic buildings and commercial agricultural facilities.
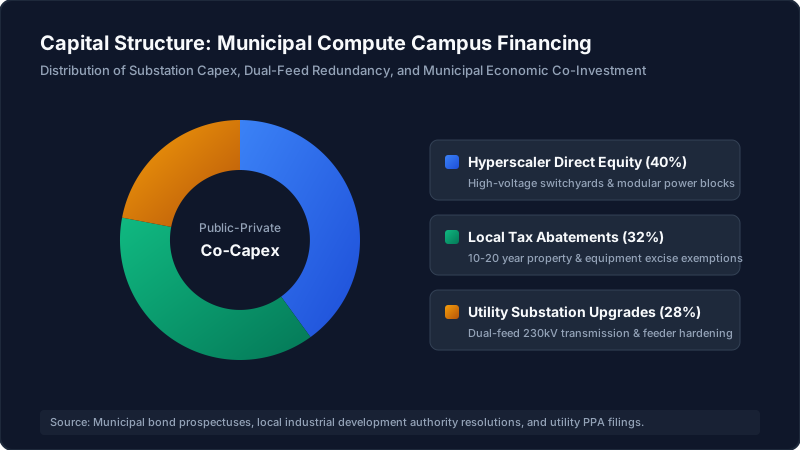
6. Public-Private Co-Capex: The Triple-Pillar Capital Structure
The rapid capitalization of 5,370 MW in municipal compute infrastructure has required a sophisticated public-private financing architecture. Because municipal power authorities cannot balance hundreds of millions of dollars in speculative transmission upgrade debt on local balance sheets, project finance structures have evolved into a three-way capital co-investment framework.
Auditing development agreements and municipal bond prospectuses across public utility districts reveals a standard capital allocation breakdown:
- Hyperscaler Direct Equity (40%): Enterprise computing operators and infrastructure funds provide 40% of upfront capital to fund high-voltage switchyards, specialized modular transformers, direct-burial fiber backbones, and on-site distribution conduits. This capital is deployed as non-refundable customer-financed construction advances.
- Local Government Tax Abatements (32%): Municipalities and county industrial development boards provide 32% of total project economic value through structured 10- to 20-year exemptions on local property taxes, real estate surcharges, and computer equipment excise taxes. In exchange, municipalities secure contracted payments in lieu of taxes (PILOT) and long-term public infrastructure upgrades.
- Utility Substation Upgrades (28%): The municipal electric utility contributes 28% of project capital through low-cost municipal revenue bonds and dedicated transmission rate riders, funding dual-feed transmission line reinforcements, system protection telemetry, and grid stability equipment.
This co-investment mechanism aligns financial incentives across public and private stakeholders. For the municipality, the facility guarantees substantial baseline electrical utility revenues, anchors local technical employment, and expands municipal tax equity without burdening residential rate classes. For the compute operator, the co-investment delivers binding capacity allocation, complete protection against retail rate escalation, and unprecedented deployment velocity.
7. Strategic Implications for Infrastructure Allocation in Late 2026
The structural migration of enterprise compute toward municipal utility districts reflects a broader maturation of digital infrastructure economics. In an operating environment defined by transmission queue paralysis and escalating power tariffs, energy procurement has evolved from a routine real estate leasing check-box into the single most decisive determinant of computational competitiveness.
Institutional capital allocators tracking the semiconductor and cloud computing sectors must expand their surveillance beyond corporate quarterly earnings calls and chip design product roadmaps. The true leading indicators of deployment velocity reside in public municipal power utility board minutes, local government tax incentive resolutions, and FERC Form 714 electrical system demand disclosures. Organizations that successfully navigate this structural shift—locking in 14-month municipal interconnect agreements and $48/MWh public power tariffs—will establish an unassailable operational moat, while those languishing in regional utility queues will face escalating capital drag and operational obsolescence.
For programmatic tracking of real-time power interconnection queues, municipal grid allocations, and high-density compute cluster intelligence, monitor the institutional datasets at Gemral Edge Intelligence.