$228 Billion: What the Hyperscaler Capex Race Reveals About AI's Real Adoption Curve

Amazon, Microsoft, Alphabet, and Meta collectively disclosed $228 billion in capital expenditure for calendar year 2024. The media called it an "AI arms race." What the public filings actually describe is something more nuanced — and more useful to read correctly.
The number is real. The framing is often not. Capital expenditure at this scale moves in three-to-four-year construction cycles. When you read the 2024 capex disclosures as proof of 2024 AI adoption, you are reading a planning decision made in 2021 and 2022 as if it is a real-time signal. The infrastructure that gets built in 2024 will be deployed through 2026 and 2027. That distinction matters if you are trying to read where AI adoption actually is — not where it was when the concrete was poured.
This piece is about reading the adoption curve from public data, not from announcement cycles. There are four independent data layers — capex, hardware revenue, energy infrastructure, and workforce signals — each visible in public filings. Read together, they place the AI infrastructure buildout somewhere that surprises most observers: already past the early adopter phase, entering the early majority inflection, but not yet at the saturation point that headlines imply.
1. The $228 Billion Number Nobody Is Reading Correctly
Let's establish what the numbers actually say. Amazon disclosed $83 billion in total capital expenditure for calendar year 2024 in its Q4 2024 earnings release, with management identifying AWS data center buildout as the primary driver of the year-over-year increase. Microsoft's fiscal year 2024 filing reported $55.7 billion in capital expenditures — its single largest annual capex figure since the company went public. Alphabet disclosed $52.5 billion for calendar year 2024. Meta reported $37.3 billion for 2024 and guided fiscal year 2025 capex to a range of $60 to $65 billion, a nearly 70 percent increase, on its Q4 2024 earnings call.
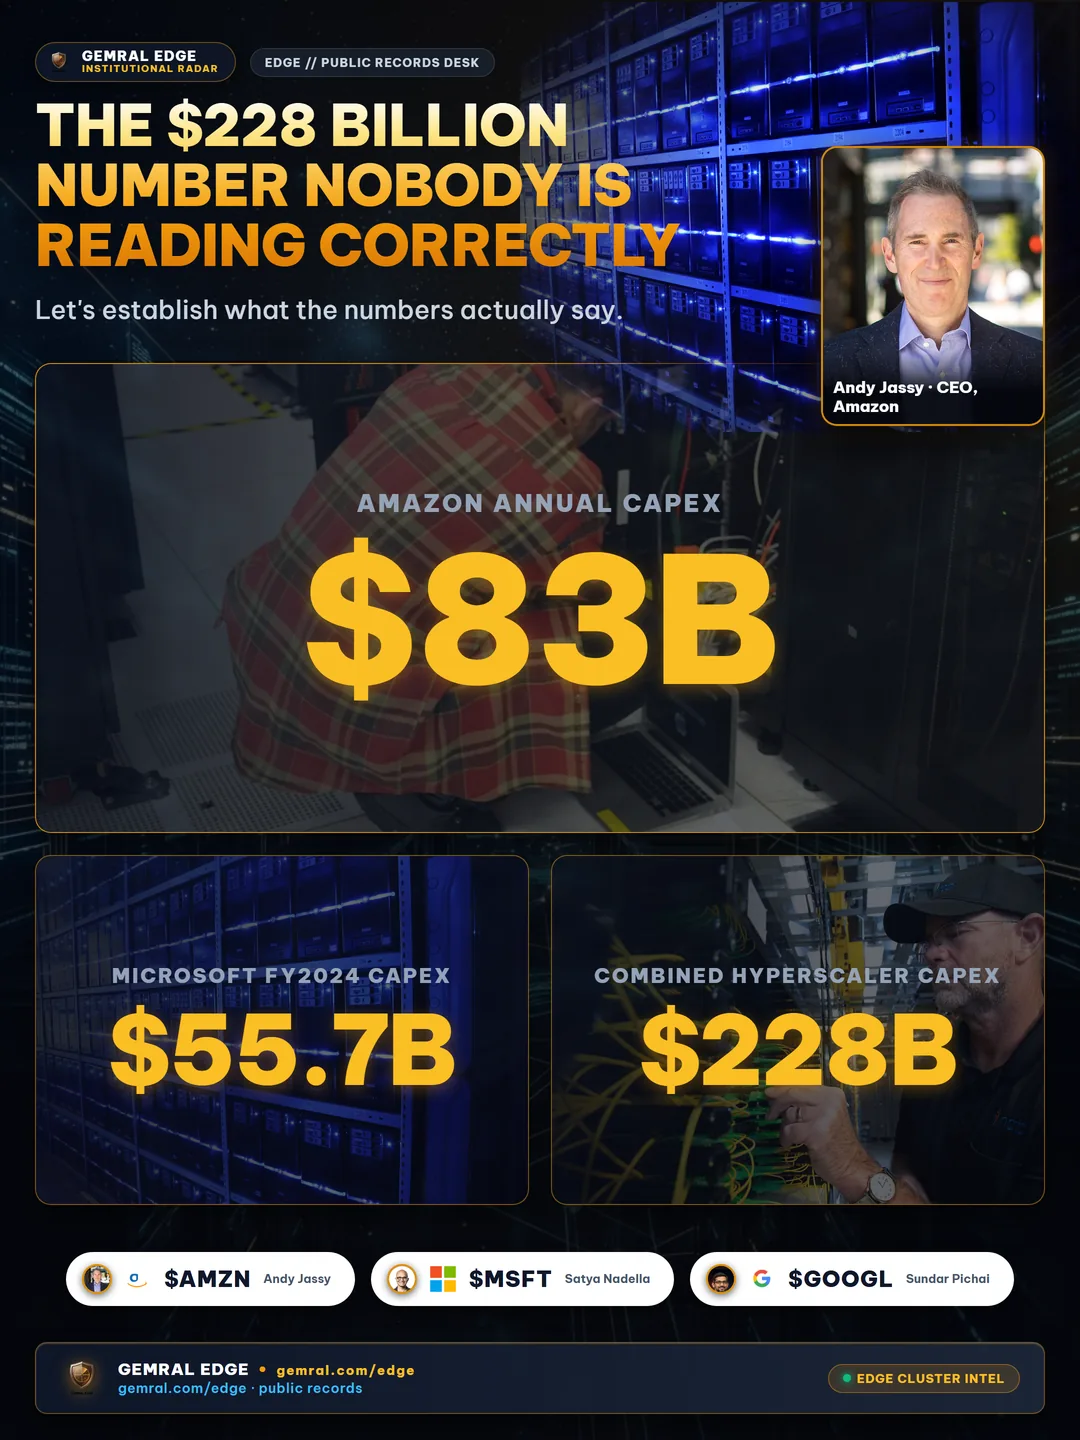
The mistake most readers make is treating the capex total as a measure of current AI capacity. It is not. Capital expenditure at this scale reflects a commitment to future capacity — data centers that will be commissioned across 2025, 2026, and 2027. What is already operational is a fraction of what has been spent. The lag between a capital commitment and a live, revenue-generating data center typically runs twelve to twenty-four months for large facilities, depending on power availability and construction timelines.
The more precise reading: the 2024 capex announcements tell you that in 2021 and 2022, four of the largest technology companies independently concluded that demand for AI compute would justify decades-long infrastructure commitments. That consensus — not the dollar figure itself — is the durable signal.
2. Breadth vs. Hype: The Signal Distinction That Changes the Analysis
The AI coverage cycle runs on hype signals: ChatGPT user counts, NVIDIA stock price, CEO statements at Davos. These are real events, but they measure attention — not adoption. Attention and adoption are correlated in the early stages of a technology wave and decorrelate sharply as adoption moves from the innovator class into the broader market.
A hype signal tells you that a technology is being discussed widely. A breadth signal tells you that a technology is being deployed widely. Those are different questions with different answers at different moments in the adoption curve.
The breadth signal for AI infrastructure comes from three observable sources: where capex is flowing across the hardware supply chain, where energy commitments are being made, and where AI-related workforce hiring is spreading beyond the technology sector. Each of these is individually public. None of them requires inferring intent from a press release.
The relevant question for 2025 is not whether AI is "overhyped" — a question that confuses media intensity with commercial deployment — but rather at what point on the adoption S-curve the infrastructure buildout sits, based on evidence that can be counted.
3. The Hardware Layer: NVIDIA's Data Center Revenue as a Supply-Chain Proxy
The cleanest single number for the state of AI infrastructure investment is NVIDIA's data center segment revenue, because it represents hardware actually shipped and accepted — not announced, not funded, but installed in operating facilities. NVIDIA reports this segment in its quarterly and annual filings to the SEC.

For fiscal year 2021 through fiscal year 2023, NVIDIA's data center revenue grew steadily but not dramatically — from $6.7 billion to $15.0 billion over four years. The acceleration in fiscal year 2024 ($47.5 billion) and the subsequent leap to $115.2 billion in fiscal year 2025 do not describe a linear trend. They describe a demand step-change that is consistent with a technology moving from early adopter to early majority — the steepest segment of an S-curve where infrastructure must be built out in advance of widespread use.
When the hardware revenue of a single supplier nearly triples in one fiscal year, the standard interpretation is "exceptional demand." The more precise reading: the customer base has widened. Hyperscalers buying GPUs for their own use is not the same signal as hyperscalers buying for enterprise customers who are, in turn, deploying AI at the application layer. The latter is the adoption breadth signal. NVIDIA's own earnings commentary in 2024 consistently noted that the customer mix was broadening toward enterprise and sovereign customers — a qualitative breadth indicator embedded in a public earnings call.
4. Energy as a Forcing Function — and a Bottleneck
The constraint that separates AI infrastructure from software rollouts is power. Software can be deployed in hours. Data centers require electricity, and the grid interconnection queue in the United States is now measured in years, not months. Power purchase agreements — the long-term contracts that guarantee electricity supply to large facilities — are filed with state utility commissions and federal regulators, making them observable without any proprietary data.
The IEA's 2024 Electricity Report estimated that global data center electricity consumption could nearly double between 2022 and 2026 — from roughly 460 terawatt-hours annually to more than 945. That is a rate of increase not seen since the early buildout of internet infrastructure in the late 1990s. The comparison is useful not as a hype lever but as a calibration: the late 1990s internet buildout had a structural correction that the AI infrastructure build is, so far, avoiding because demand for AI compute is distributed across a broader set of customers from the start.
The energy constraint also functions as a natural throttle on adoption speed. A company that wants to deploy large-scale AI workloads cannot do so faster than it can secure power agreements and physical data center space. That physical constraint means that the adoption curve — even in an accelerating period — cannot go vertical overnight. It creates a measurable ceiling on near-term deployment velocity that any serious analysis of adoption timing needs to account for.
5. What Hiring Signals Tell You That Stock Prices Cannot
The most underused public dataset in AI adoption analysis is hiring data. Job postings are public. They contain more granular information about organizational intent than any earnings call, because they are operational commitments — a company posts a job when it has a budget approved, a team authorized, and a specific technical role to fill. The gap between a strategic announcement and an actual job posting is typically four to eight months. By the time you see a hiring surge, the decision has already been made and funded.
The sector distribution of AI hiring is the clearest available evidence that the adoption wave has moved past the technology sector into the broader economy. Financial services firms advertising for AI risk and compliance roles, healthcare organizations hiring for clinical AI specialists, manufacturers posting for AI-driven quality control engineers — these postings do not come from companies exploring a concept. They come from organizations with approved headcount and defined use cases.
The distinction between AI job postings in technology companies and AI job postings in non-technology companies tracks the shift from infrastructure provision to infrastructure consumption. When the financial services sector is advertising for MLOps engineers, the question of whether AI infrastructure will be used is already answered. The remaining question is how fast.
Federal government hiring data shows a similar pattern. Public job listings from defense and civilian agencies advertising for AI engineering, AI program management, and AI procurement roles reflect congressional and executive appropriations that have already cleared the budget process. Federal adoption of AI — which is subject to longer procurement cycles than private sector adoption — is nevertheless measurable through the same public record.
6. Reading the Adoption Curve from the Four Signals Together
The S-curve of technology adoption — slow initial growth, rapid acceleration through the middle, plateau as saturation approaches — is a useful organizing framework, but only if you locate the technology correctly on it. Misreading the phase leads to symmetric errors: declaring the technology "over" too early, or expecting vertical growth past the inflection point.
Reading the four public signals together produces a specific location on that curve. Capex scale confirms that the largest operators have already made committed, multi-year bets on AI demand. Hardware revenue growth confirms that committed capital is being converted to installed hardware — that the money is not merely sitting in announced plans. Energy constraints confirm that physical adoption is moving fast enough to stress existing grid infrastructure — a characteristic of the early majority phase, not the innovator phase. Sector-wide hiring breadth confirms that organizations outside the technology industry have moved past evaluation into operational deployment.
None of these signals individually would settle the question. Together, they place AI infrastructure in the early majority phase — roughly where cloud infrastructure was between 2011 and 2014. That comparison carries a specific implication: the cloud infrastructure buildout that appeared overbuilt in 2010 became foundational to the economy within a decade. The question for AI infrastructure is not whether it will be used — the hiring and hardware data answer that — but at what pace the late majority of organizations will follow the early majority that has already committed.
The pace question is what makes reading breadth signals systematically valuable. Hype signals give you noise. Breadth signals — capex filings, hardware revenue, power agreements, cross-sector job postings — give you a countable edge.
Gemral Edge tracks tech adoption signals, federal contract data, congressional disclosures, and macro indicators — all drawn from public records and surfaced in one place.
Semiconductor Demand: Heavy exposure to mega-cap chipmakers in the Nancy Pelosi stock holdings provides empirical grounding for enterprise datacenter buildout pacing.