Paul Tudor Jones 200-Day Moving Average & Inflation Guide
Paul Tudor Jones 200-Day Moving Average Rule & Inflation Playbook
Renowned for predicting the 1987 Black Monday crash, Tudor Investment Corporation founder Paul Tudor Jones maintains a steadfast philosophy: capital preservation precedes profit generation. Discover how the simple 200-day moving average acts as the ultimate macro regime filter, and examine his modern framework for hedging sovereign fiscal debasement with hard commodities, Gold, and Bitcoin.
PTJ 200 DMA Regime & Inflation Asset Evaluator
Simulate technical regime filtering against the 200-day moving average benchmark and determine optimal asset allocation across Gold, Bitcoin, Commodities, and Defensive Cash.
- Distance from 200 DMA:
- Trend Regime Signal:
- Drawdown Risk Buffer:
- Hard Asset Basket Weight:
- PTJ Defensive Score:
- Execution Directive:
The 200-Day Moving Average: Capital Defense Line
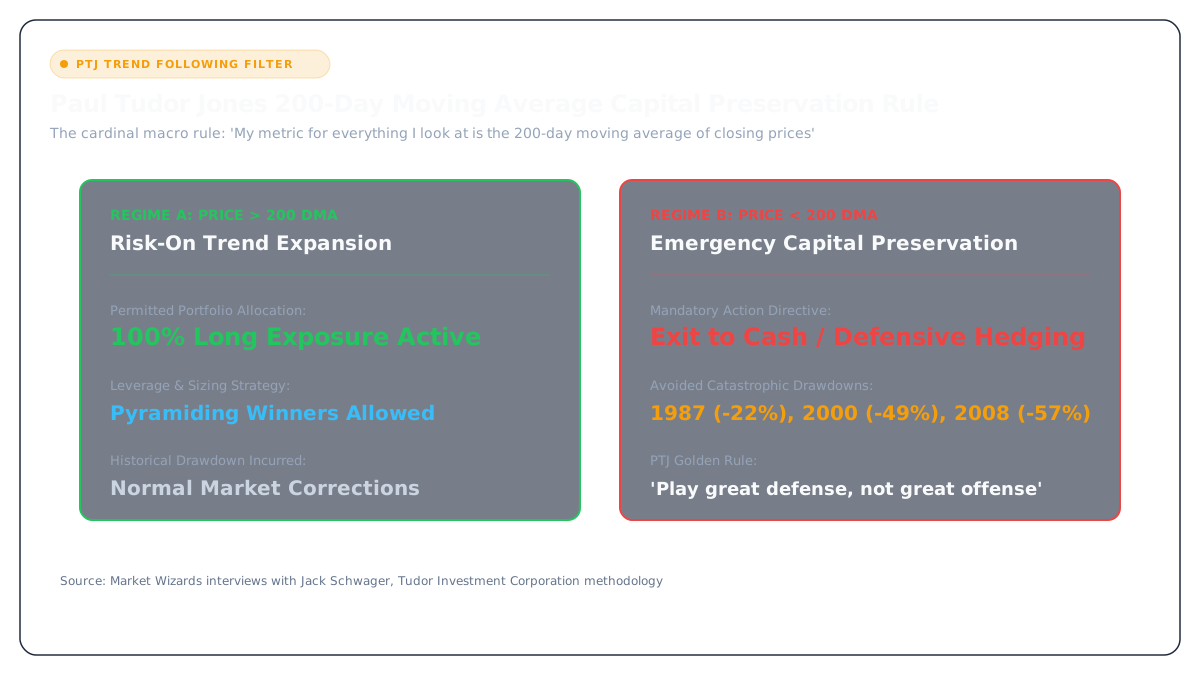
In Tony Robbins' classic work 'Money: Master the Game', Paul Tudor Jones revealed his single most important technical metric: 'My metric for everything I look at is the 200-day moving average of closing prices. I've seen too many things go to zero, stocks and commodities. The whole trick in investing is: How do I keep from losing everything? If you use the 200-day moving average rule, then you get out on that signal.'
PTJ's mechanical rule dictates that when an asset drops beneath its 200-day simple moving average (200 DMA), all long equity positions are immediately liquidated or hedged into cash equivalents. Conversely, long positions are only initiated or held when price action sustains above the rising 200-day moving average. This binary filter eliminates emotional holding during multi-year secular bear markets such as the 2000-2002 Dot-com bust, the 2008 Global Financial Crisis, and the 2022 tech drawdown.
Quantitative backtests across century-long S&P 500 index history prove the value proposition of PTJ's 200-day trend rule. While the raw annualized return of a 200 DMA timing model matches or slightly lags a blind Buy-and-Hold strategy due to occasional whipsaws in rangebound consolidation periods, the risk-adjusted Sharpe and Sortino ratios dramatically outperform. Maximum historical drawdown contracts from -55% in 2008 to under -20% across systematic trend regimes.
More critically, PTJ combines the 200 DMA filter with an asymmetric 5:1 risk-to-reward requirement. By risking $1 to make $5, a macro trader only needs a 20% win rate to break even. When trend signals trigger entry above the 200 DMA, aggressive pyramiding on winning trades is permitted, whereas losing trades are stopped out instantly when prices breach defined technical pivots or retest the 200 DMA from above.
Mechanical Regime Filtering: Trend Following vs Defensive Cash
Market regime identification separates institutional macro titans from retail speculators. When an index trades above its 200-day moving average, market volatility clustering typically compresses, creating favorable conditions for positive drift and momentum strategies. Breakouts succeed with higher probability, and dips are systematically absorbed by institutional allocators rebalancing equity exposure.
Conversely, once closing prices crack beneath the 200 DMA, volatility regimes flip from mean-reverting to fat-tailed expansion. Downside tail-risk events cluster almost exclusively beneath the 200-day line. By enforcing a mandatory liquidation trigger upon a decisive 200 DMA violation, PTJ insulates capital against systemic credit crunches, cascading liquidity spirals, and forced deleveraging events.
To avoid false-breakout whipsaws in whipsaw-prone consolidating markets, modern implementations of PTJ's rule incorporate a 1% to 3% band or a multi-day closing filter (e.g., three consecutive daily closes below the moving average). This smoothing mechanism filters out intraday stop-runs while preserving the core protective objective of macro capital preservation.
Furthermore, PTJ emphasizes evaluating the slope of the 200-day moving average itself. A rising 200 DMA with price trading above it represents an ideal bullish macro trend environment. A flattening or rolling-over 200 DMA serves as an early structural warning that market breadth is deteriorating, prompting risk managers to reduce gross leverage well before price decisively breaches the line.
The Great Monetary Debasement: PTJ Inflation Basket
In May 2020, Paul Tudor Jones published his seminal investor letter entitled 'The Great Monetary Inflation' (GMI), making institutional history by allocating 1-2% of his assets into Bitcoin. PTJ stated: 'Bitcoin reminds me of gold when I first got into the business in 1976... It is the fastest horse in the race against sovereign fiat currency devaluation.'
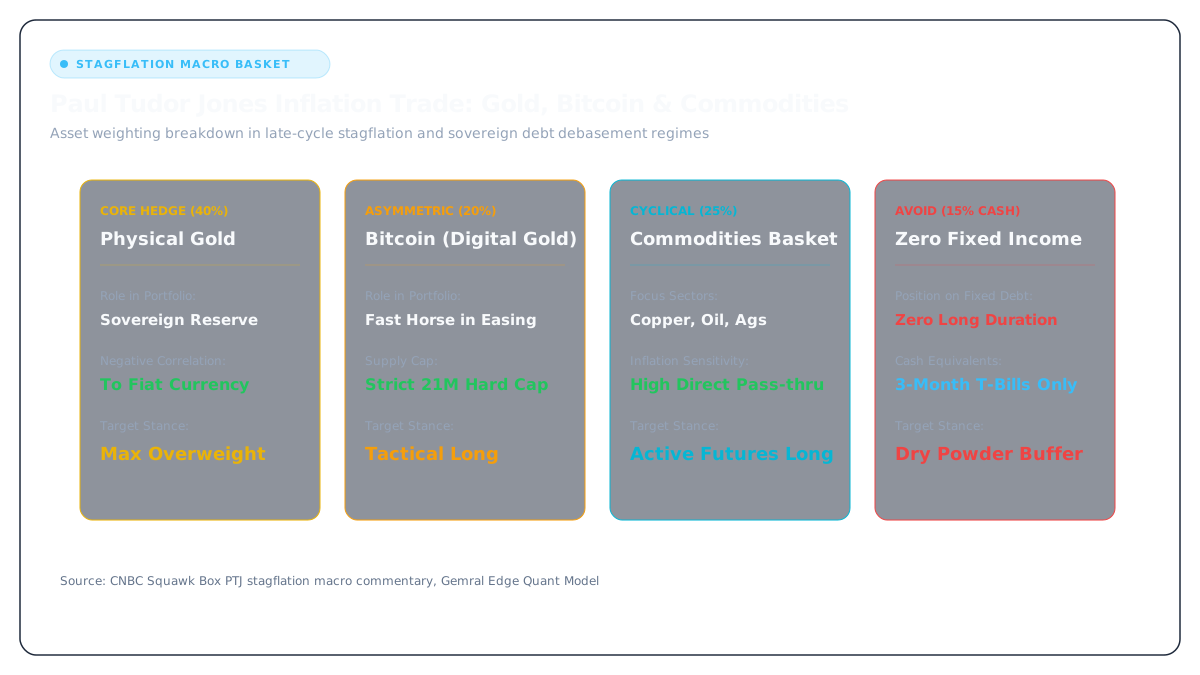
In recent macro interviews spanning 2024 through 2026, PTJ expanded his thesis: soaring US federal debt exceeding $35 trillion and annual fiscal deficits of $2 trillion create an inescapable debt spiral. Whichever political administration holds office, governments inevitably inflate their way out through negative real interest rates and currency debasement. PTJ's battle-tested portfolio strategy consists of four core inflation pillars: Physical Gold, Bitcoin, Commodities, and High-Pricing-Power Equities.
Gold represents the millennia-old anchor of sovereign monetary legitimacy. As global central banks across BRICS nations accelerate de-dollarization and diversify official reserves away from US Treasuries, institutional demand for physical gold creates a secular floor under precious metals pricing, regardless of nominal interest rate hikes.
Bitcoin serves as digital gold with programmatic scarcity and instantaneous global portability. With a hard-coded cap of 21 million coins and quadrennial halvings slashing daily issuance, Bitcoin offers an unmatched supply-inelastic response to global fiat debasement. Tudor Jones identified that in an era of fiscal dominance, holding a blend of both physical and digital monetary hedges provides optimal asymmetric defense.
Commodity Supercycles & Raw Material Supply Deficits
Beyond monetary metals and digital assets, Paul Tudor Jones maintains substantial positioning in physical industrial and energy commodities. Historical inflation shocks—from the 1970s oil embargoes to modern supply-chain fragmentations—demonstrate that raw physical materials provide the purest real-time pass-through of consumer price index surges.
Structural underinvestment in global mining extraction, copper electrification bottlenecks, and agricultural volatility driven by geopolitical trade friction have established a multi-year secular deficit across key commodity complexes. When paper financial assets suffer from stagflationary multiple compression, raw commodities generate positive roll yields and direct purchasing power protection.
PTJ's macro framework advises dynamic commodity basket rotation. When global manufacturing indicators expand while price remains above the 200-day moving average, exposure tilts heavily toward industrial metals such as copper and nickel. When geopolitical conflict escalates, energy contracts and precious metals receive disproportionate capital allocation.
The synchronization of monetary inflation, fiscal deficit monetization, and physical resource shortages creates what PTJ describes as an explosive macro confluence. Investors attempting to navigate this regime with conventional 60/40 stock-and-bond portfolios face severe real-term wealth destruction, reinforcing the necessity of an active multi-asset inflation hedge.
Asymmetric Risk Management: The 5-to-1 Payoff Matrix
The ultimate pillar of PTJ's trading methodology is asymmetric risk-to-reward ratio management. Jones famously seeks trading opportunities where the upside profit target is at least five times the capital risked on the downside. This 5:1 ratio provides immense mathematical resilience against market unpredictability.
Under a 5:1 framework, an investor can experience four consecutive losing trades and a single winning trade, yet still achieve an overall profitable outcome. If an investor risks $1,000 across five trades and loses four ($4,000 lost), the fifth winning trade generates $5,000, yielding a net profit of $1,000 despite an apparent 20% win rate.
Achieving 5:1 asymmetric payoffs requires relentless entry discipline. PTJ enters positions only near major support pivots, breakout retests, or inflection points where an invalidation stop-loss can be tightly placed. If price immediately moves in the intended direction, risk is promptly reduced to breakeven, allowing profits to compound without endangering baseline capital.
By integrating the 200-day moving average regime filter with an asymmetric 5:1 payoff architecture and a hard-asset inflation basket, Paul Tudor Jones provides the definitive playbook for weathering secular fiscal inflation while aggressively capturing generational macro trends.
Access Real-Time Terminal Intelligence & Quantitative Signals
Unlock instant Telegram alerts, full congressional portfolio archives, and algorithmic catalyst radar.
Upgrade to Gemral Edge Pro ($39/mo)Frequently asked questions
Why does Paul Tudor Jones specifically use the 200-day moving average?
The 200-day moving average represents approximately 40 trading weeks, capturing intermediate-to-long term secular market trends. It filters out high-frequency market noise while providing a reliable technical boundary between healthy bull markets and catastrophic bear market liquidation cascades.
How does PTJ handle false breakout whipsaws around the 200 DMA?
PTJ incorporates time-based confirmation filters (such as requiring weekly close confirmation above or below the line) alongside strict asymmetric risk parameters (5:1 profit/loss targets). Minor whipsaw losses are treated as basic insurance costs to safeguard against severe 50%+ drawdowns.
What is Paul Tudor Jones's target allocation for Bitcoin and Gold?
PTJ has publicly favored having a basket allocation of around 5% in Bitcoin and substantial positions in Gold and commodities when macroeconomic conditions indicate persistent debt monetization and runaway government deficits.
How does the 5:1 risk-to-reward ratio work in practice?
A 5:1 ratio requires identifying trade setups where potential profit is five times larger than the defined stop-loss distance. This allows the trader to remain profitable with a win rate as low as 20%, ensuring long-term institutional survival.
Risk Disclaimer
Trading and investing in digital assets, financial instruments, and predictive events involve substantial risk of loss and are not suitable for every investor. The predictive intelligence, probability distributions, historical precedents, and scenario modeling presented on this page are compiled for informational and research purposes only and do not constitute financial, investment, legal, or tax advice. Past performance and statistical precedents do not guarantee future outcomes. Always conduct independent due diligence before committing capital.