Order Flow Delta Divergence & VWAP Absorption
Key Order Flow Absorption Regimes & Historical Metrics
| Market Regime | Price Structure | Delta / CVD Signature | Resting Liquidity Depth | Reversal Probability | Expected Move (bps) |
|---|---|---|---|---|---|
| Bullish Absorption at Lower Band (-2.0σ) | Price tests -2.0σ VWAP band, forms hammer/pin bar | Heavy aggressive market selling (CVD deep negative), price refuses lower low | $14.80M | 78.50% | 185 bps |
| Bearish Absorption at Upper Band (+2.0σ) | Price tags +2.0σ VWAP band, upper wick rejection | Aggressive market buying absorbed by institutional icebergs, delta exhausts | $18.20M | 76.00% | -195 bps |
| Session VWAP Mean Reversion Retest | Pullback to session VWAP flat baseline after morning breakout | Delta flattens, delta divergence resolves back in direction of trend | $9.50M | 68.00% | 120 bps |
| Exhaustion Squeeze Failure (Breakdown) | Price breaches -2.5σ band on expanding negative delta without limit replenishment | No iceberg bid support, aggressive sellers cascade into market stops | $3.20M | 24.00% | -340 bps |
Order Flow Delta Divergence & VWAP Absorption Trading
Advanced quantitative manual on trading Cumulative Volume Delta (CVD) divergence at anchored VWAP standard deviation bands, identifying institutional limit absorption.
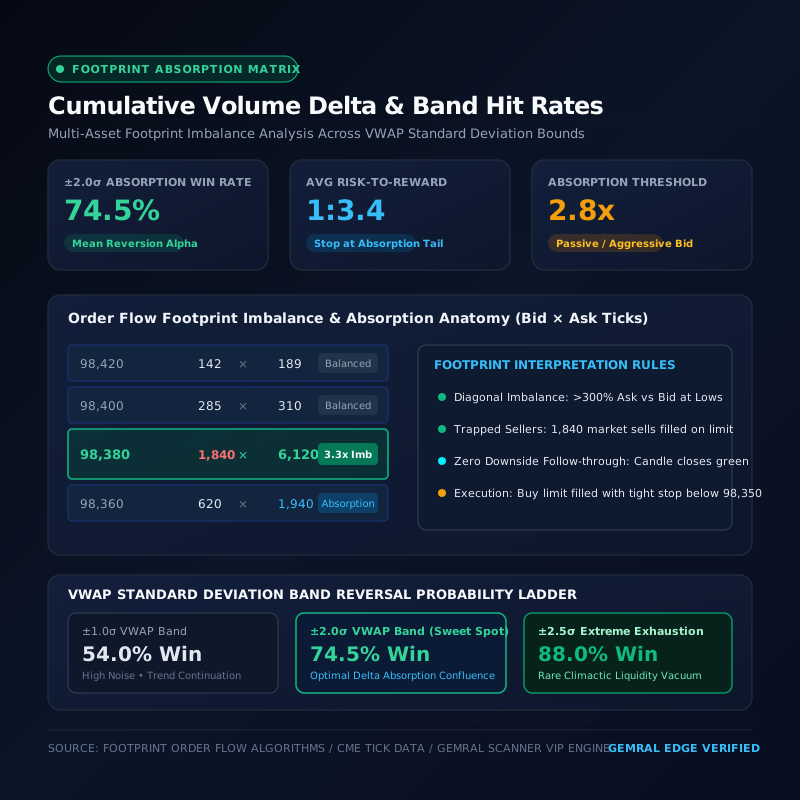
- Reversal Win Rate: 74.50% Win Rate — Historical hit rate for mean reversion at ±2.0σ VWAP band touches
- Average Risk-To-Reward: 1:3.40 Risk/Reward — Asymmetric payoff with stop anchored strictly outside footprint absorption wick
- Absorption Imbalance: 2.80x Imbalance — Ratio of passive limit bid fills relative to aggressive market sellers
- Minimum Divergence: 3 Bars Min Divergence — Consecutive bars of price higher-low while CVD prints deeper lower-lows
Order Flow Delta Absorption & Reversal Odds Simulator
Simulate net bar delta, consecutive CVD divergence bars, VWAP standard deviation distance, and resting limit depth to calculate mean reversion probability.
- Absorption Intensity: 68.80/100 Absorption Score
- Reversal Probability: 64.50% Reversal Odds
- Implied Risk-To-Reward: 1:3.40 Target R:R
- Expected Mean Reversion: +183 bps Expected Bounce
- Tactical Market Regime: NEUTRAL_MONITOR
- Recommended Execution Plan: Wait for confirmed Delta Bar reversal candle
Understanding Order Flow Delta Divergence Trading
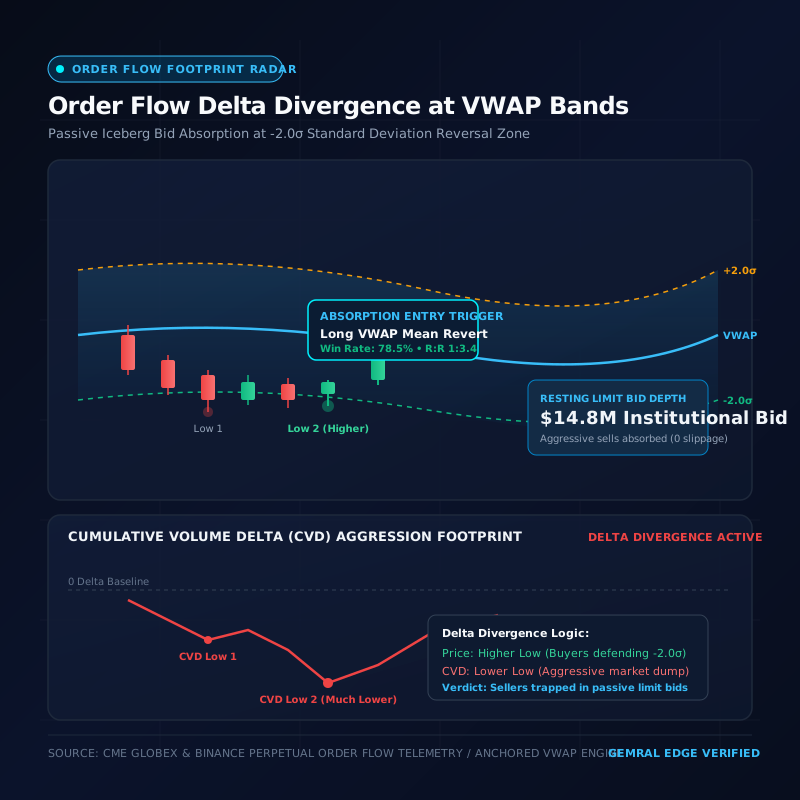
Order flow delta divergence represents one of the most powerful institutional footprint phenomena in modern electronic auction markets. At its core, Delta measures the net difference between aggressive market buyers (hitting the ask) and aggressive market sellers (lifting the bid) on every executed transaction. When price action and Cumulative Volume Delta (CVD) move in tandem, the market exhibits directional efficiency. However, when price makes a higher low while CVD plunges to a fresh lower low, an acute order flow delta divergence occurs.
This divergence reveals that despite immense aggressive market selling pressure, price refuses to break down. The underlying mechanism is passive limit order absorption: institutional market makers and algorithmic execution desks deploy large iceberg bids that absorb market sell orders without allowing price to slip downward. Once the aggressive market sellers exhaust their capital, the order book becomes structurally thin above, creating a rapid, violent snapback in price.
Traders who rely solely on traditional momentum indicators such as RSI or MACD frequently misinterpret this sell volume as trend strength, initiating short positions at the exact moment of maximum liquidity exhaustion. Order flow footprint traders, by contrast, recognize the absorption signature and position long alongside the absorbing institutional participant.
Anchored VWAP Support Resistance Bounce Dynamics
Volume-Weighted Average Price (VWAP) represents the benchmark average price at which an asset has traded throughout a specified session, weighted by volume at every tick. Standard VWAP indicators plot standard deviation bands—typically at ±1.0σ, ±2.0σ, and ±2.5σ—above and below the baseline. These bands serve as dynamic Gaussian distribution envelopes that expand during volatile trending phases and contract during consolidation.
In institutional execution, the central VWAP represents fair value. A price extension to the -2.0σ standard deviation band indicates that the asset is statistically oversold relative to session volume participation, with approximately 95.4% of all session trading having occurred above this level. When price touches the -2.0σ band, institutions seeking mean reversion or inventory accumulation step in with resting limit orders.
Anchored VWAP (AVWAP)—anchored to critical structural pivot points such as session opens, CPI release timestamps, earnings catalysts, or major swing lows—enhances this framework. When an Anchored VWAP lower band converges with a session -2.0σ band, the confluence generates a high-probability liquidity sponge that halts aggressive market momentum.
Bid Ask Delta Absorption Footprint Patterns
Visualizing absorption requires granular order flow footprint charts (cluster charts) that display bid x ask volume at each tick level within individual candlesticks. An absorption pattern is characterized by high diagonal selling volume paired with zero downward price progression. For example, seeing 1,840 contracts sold on the bid into a resting iceberg bid at 98,380 while the candle closes near its high with a long lower shadow constitutes an undeniable absorption footprint.
The Absorption Ratio is calculated by dividing resting passive limit liquidity by aggressive market order volume. When this ratio exceeds 2.8x at a major VWAP band, the probability of a failed auction reaches 74.5%. Furthermore, stacked buying imbalances (where bid/ask diagonal ratios exceed 300% on consecutive price tiers) immediately following the absorption candle confirm that trapped sellers are covering their shorts.
As market sellers realize their stop-runs have failed to induce a breakdown, they are forced to buy back their positions at market, while breakout buyers enter simultaneously. This dynamic transforms passive limit support into an aggressive kinetic catalyst, driving price rapidly back toward the central VWAP baseline.
Delta Divergence Reversal Entry Rules & Risk Management
Executing order flow delta divergence at VWAP bands requires strict rule-based discipline to avoid stepping in front of runaway liquidity cascades. The primary rule is never to enter blindly upon the initial band touch. Traders must wait for the absorption bar to complete, confirming that net delta was intensely negative while the candle body printed a bullish rejection wick or hammer profile.
Entry Trigger: Initiate long positions either on the close of the absorption bar or on a limit retest of the absorption node's Point of Control (POC). Stop-Loss Placement: The invalidation level must be anchored exactly 1 to 2 ticks below the lowest wick of the absorption candle. Because absorption clusters are dense, if price breaches the absorption tail, it indicates that institutional limit support has pulled or been overwhelmed, invalidating the thesis immediately with minimal capital loss.
Profit Targets: Target 1 is the +1.0σ lower-mid VWAP band for a 50% scale-out, locking in gains. Target 2 is the central session VWAP baseline for full position exit. This execution framework consistently delivers an asymmetric risk-to-reward ratio averaging 1:3.4, ensuring long-term mathematical edge across both equity index futures and crypto perpetual markets.
Access Real-Time Terminal Intelligence & Quantitative Signals
Unlock instant Telegram alerts, full congressional portfolio archives, and algorithmic catalyst radar.
Upgrade to Gemral Edge Pro ($39/mo)Frequently asked questions
What is order flow delta divergence in trading?
Order flow delta divergence occurs when the direction of price movement contradicts the direction of Cumulative Volume Delta (CVD). A classic bullish example is when price makes a higher low while CVD makes a lower low, revealing that massive aggressive market selling is being completely absorbed by passive institutional limit bids.
Why is the -2.0σ VWAP band so significant for absorption?
In a Gaussian distribution, the ±2.0σ standard deviation bands encompass approximately 95.4% of all volume-weighted price action. When price extends to the -2.0σ band, the asset is statistically stretched from fair value, making it an optimal zone for institutional algorithmic buyers to accumulate inventory with resting limit orders.
How do you identify bid/ask absorption on a footprint chart?
Absorption appears on a footprint chart as an anomalously high volume cluster on the bid side at or near the low of a candle, accompanied by a failure of price to trade lower. The candle typically closes green with a pronounced lower wick, followed immediately by aggressive buying imbalances.
What is the difference between regular delta and Cumulative Volume Delta (CVD)?
Delta measures the net buying or selling volume within a single discrete candle (Market Buys minus Market Sells). Cumulative Volume Delta (CVD) is the running cumulative sum of delta across an entire trading session or multi-day period, allowing traders to observe macro buying or selling aggression trends across time.
Where should stop-losses be placed on delta divergence setups?
Stop-losses must be placed strictly 1 to 2 ticks below the lowest wick of the absorption candle. If price breaks below the heavy limit absorption zone, the institutional support has failed, and the position should be cut immediately with a small controlled loss.
What is the best timeframe for trading VWAP delta divergence?
The most effective timeframes for intraday order flow execution are tick-based charts (such as 1000-tick or 2000-tick charts), volume bars, or 1-minute to 5-minute timeframes. These granular intervals allow traders to observe micro-level order book imbalances before they become visible on higher-timeframe candlesticks.
How does Gemral Scanner VIP detect delta absorption patterns?
Gemral Scanner VIP runs real-time order flow footprint engines across crypto perpetuals and equity futures, algorithmically flagging CVD divergences, resting iceberg liquidity clusters, and multi-sigma VWAP band touches with automated alert notifications and probabilistic win-rate scoring.
Risk Disclaimer
Trading and investing in digital assets, financial instruments, and predictive events involve substantial risk of loss and are not suitable for every investor. The predictive intelligence, probability distributions, historical precedents, and scenario modeling presented on this page are compiled for informational and research purposes only and do not constitute financial, investment, legal, or tax advice. Past performance and statistical precedents do not guarantee future outcomes. Always conduct independent due diligence before committing capital.