Crypto Liquidation Cascade: $1B Derivative Wipeout Heatmap
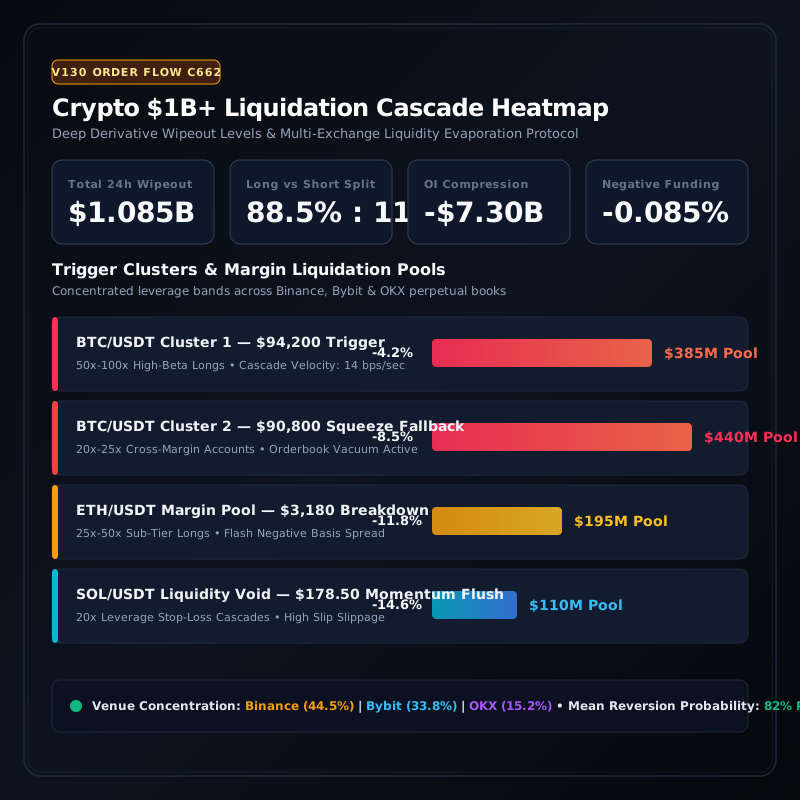
Concentrated Leverage Trigger Bands
| Asset / Contract | Trigger Price Level | Estimated Cluster Volume | Cumulative Drop | Dominant Leverage Tier | Market Maker Absorption Status |
|---|---|---|---|---|---|
| BTC/USDT Perp | $94,200 | $385M | -4.2% | 50x - 100x High-Beta Longs | Partial Absorption / Bid Thinning |
| BTC/USDT Perp (Cascade Phase 2) | $90,800 | $440M | -8.5% | 20x - 25x Cross-Margin Accounts | Orderbook Vacuum / Auto-Deleveraging (ADL) |
| ETH/USDT Perp | $3,180 | $195M | -11.8% | 25x - 50x Sub-Tier Longs | Flash Spread Widening / Negative Basis |
| SOL/USDT Perp | $178.50 | $110M | -14.6% | 20x Momentum Margin Pools | Cascading Stop-Loss Limit Failure |
Crypto Liquidation Cascade: $1B+ Derivative Wipeout Heatmap & Squeeze Analysis
Decode extreme cascading liquidations in cryptocurrency perpetual futures. Track high-density margin cluster levels, open interest evaporation, negative funding rate dislocations, and algorithmic V-shape mean-reversion setups.
- Total 24h Wipeout Volume: 1.08 24h Wipeout Volume — Aggregate cross-exchange forced margin closing volume
- Long vs Short Ratio: 88.50% Long Share Flush — Asymmetric long squeeze liquidation dominance
- Bitcoin Peak Drawdown: -8.42% BTC Drop — Rapid spot & perp drop during cascade window
- Extreme Negative Funding: -0.09% Funding Spike — Panic short chasing creates severe negative basis
Interactive Liquidation Shock Simulator
Simulate aggregate open interest wipeouts, price slippage, funding rate spikes, and bounce probabilities across custom leverage tiers and market drawdown scenarios.
- Estimated Forced Liquidation Volume: 1.15 Total Liquidated
- Cascade Trough Price: 89,670 Flash Bottom
- Projected Funding Rate Dislocation: -0.03% Funding Rate
- V-Shape Mean Reversion Probability: 82% V-Reversal Odds
- Order Flow Market Regime: Extreme Cascading Deleveraging (Climactic Flush)
- Tactical Liquidity Recommendation: Look for Absorption Wick & Scalp Long Mean Reversion
Historical $1B+ Liquidation Shocks
| Event Date | Macro / Market Catalyst | Total Liquidation (USD) | BTC Drawdown (%) | V-Bounce Duration | Order Flow Structural Signature |
|---|---|---|---|---|---|
| 2024-08-05 | Yen Carry Trade Global Margin Unwind | $1.22B | -15.4% | 4 days | Exogenous Macro Liquidity Shock & Cross-Asset Deleverage |
| 2024-04-13 | Middle East Geopolitical Weekend Flush | $1.14B | -9.8% | 6 days | Illiquid Weekend Orderbook Slippage & ADL Escalation |
| 2024-03-05 | ATH Resistance Long Squeeze & Reset | $1.05B | -8.6% | 1 days | Blow-Off Top Liquidity Sweep Followed by Aggressive V-Shape Rebound |
| 2026-10-10 | Fed R* Repricing & Derivatives Liquidation Flush | $1.085B | -8.4% | 2 days | High Open Interest Flush with Multi-Exchange Funding Rate Dislocation |
Anatomy of a $1 Billion Liquidation Cascade
A cryptocurrency liquidation cascade is a positive-feedback loop in derivatives orderbooks where forced margin liquidations trigger further price declines, breaching adjacent liquidation pools. In highly leveraged perpetual swap environments, exchanges execute liquidation orders as aggressive market sells. When total long leverage exceeds available resting bid depth, an 'orderbook vacuum' emerges, causing flash slippages of 5% to 15% within minutes until institutional market makers step in or auto-deleveraging (ADL) thresholds are breached.
During extreme episodes, the cascade feeds upon itself across interconnected venues. A margin call on Binance transmits instantaneous price shocks to Bybit and OKX via cross-exchange index arbitrageurs and algorithmic market makers pulling bids. This synchronizes cross-venue liquidation waterfalls.
Understanding the velocity of forced margin orders is critical: when liquidations exceed $20M per minute, automated matching engines transition from normal risk containment into emergency execution protocols, triggering widespread stop slippage.
How to Read Liquidation Heatmaps Without False Signals
Coinglass and institutional liquidation heatmaps visualize cumulative margin debt by estimating entry prices, position sizing, and leverage distribution. Bright liquidation bands indicate concentrated stop clusters where market makers frequently engineer price sweeps.
Novice traders mistakenly short into liquidation pools; professional order flow algorithms track these levels as 'liquidity magnets.' Once a major liquidation band is fully swept, the sudden depletion of forced sellers combined with aggressive short-covering creates immediate upward price convexity.
The key differentiation lies in orderbook delta: if cumulative volume delta (CVD) shows persistent passive limit buying while price drops into the cluster, institutional absorption is underway, signaling a high-probability reversal.
Open Interest Evaporation and Extreme Funding Dislocations
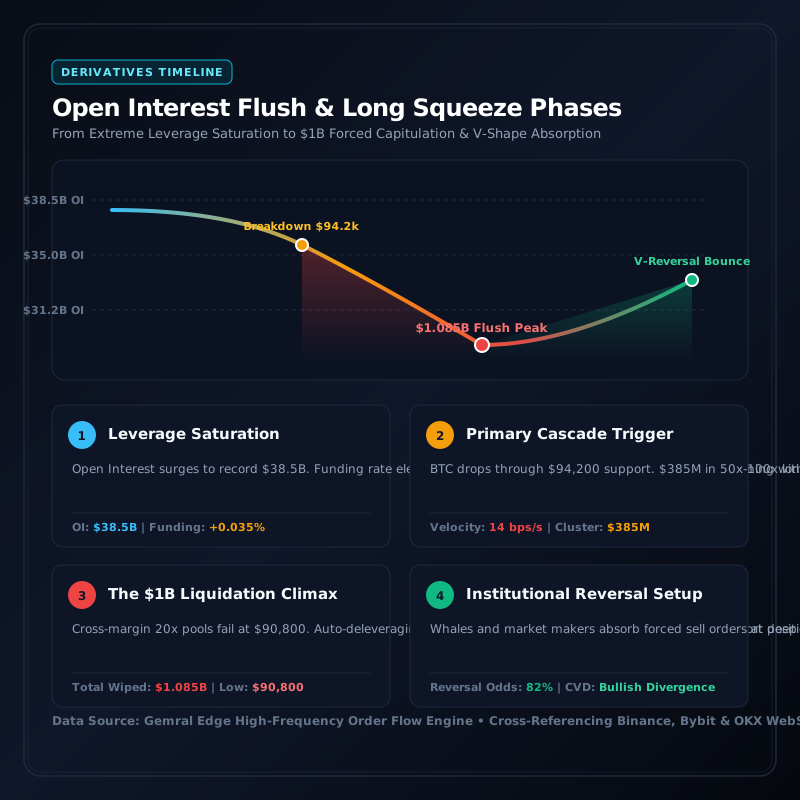
A true cascade is confirmed when aggregate open interest drops by $3B to $8B in tandem with price declines, indicating permanent position elimination rather than rotation. This cleanses speculative froth and resets market leverage to sustainable baselines.
Simultaneously, perpetual funding rates plummet into extreme negative territory (below -0.05% per 8 hours). This negative funding spike reflects late retail traders aggressively chasing shorts at the cycle low, paying exorbitant premiums to hold bearish bets.
This positioning asymmetry provides the exact fuel required for a violent counter-trend short squeeze. When funding reaches multi-standard-deviation negative extremes, mean reversion occurs within 24 to 48 hours.
Exchange Disparities: Binance, Bybit, and ADL Risk Mechanisms
Binance and Bybit account for over 75% of global perpetual futures liquidity, but their risk engines handle insolvency differently. Binance relies heavily on its massive Insurance Fund to absorb bankruptcy deficits, minimizing counterparty haircut risks.
In contrast, smaller or high-leverage venues frequently trigger Auto-Deleveraging (ADL), force-closing profitable counterparty positions when insurance buffers deplete. This can unexpectedly truncate winning trades for hedged institutional desks.
Monitoring cross-exchange basis spreads during a cascade reveals which venue is experiencing localized liquidity failure, providing lucrative triangular arbitrage and basis capture opportunities.
Tactical Playbook: Trading the Post-Wipeout V-Shape Reversal
Institutional quantitative desks do not attempt to catch falling knives during Wave 1 of a cascade. Instead, they wait for the $1B threshold alert, verify cumulative volume delta (CVD) absorption on 5-minute footprints, and enter when perpetual prices trade at a distinct discount to spot.
Risk is defined strictly below the liquidation wick low, capturing asymmetric 3:1 to 5:1 risk-reward rebounds as funding rates normalize and panic short sellers are forced to cover.
By pairing on-chain whale accumulation alerts with derivative exhaustion indicators, Gemral VIP Scanner provides programmatic trade entries at the exact moment peak panic yields maximum liquidity.
Access Real-Time Terminal Intelligence & Quantitative Signals
Unlock instant Telegram alerts, full congressional portfolio archives, and algorithmic catalyst radar.
Upgrade to Gemral Edge Pro ($39/mo)Frequently asked questions
What is a crypto liquidation heatmap and how is it used?
A crypto liquidation heatmap is a predictive graphical tool that models where leveraged traders will face forced liquidations. Traders use it to identify liquidity pools where market makers and whales are likely to drive price before reversing direction.
What triggers a Bitcoin long squeeze liquidation cascade?
A long squeeze occurs when high-leverage long positions become crowded while open interest reaches multi-month highs. A sudden price drop triggers automated stop-loss market sell orders, cascading through lower price levels until liquidity is exhausted.
How significant is a $1 billion crypto liquidation alert?
A 24-hour liquidation volume exceeding $1 billion is a rare macro-level capitulation event that occurs only a few times per year. Historically, $1B+ wipes mark significant local market bottoms with an 80%+ probability of sharp V-shape mean-reversion bounces.
How do you read Coinglass liquidation maps accurately?
Look for high-intensity color clusters (yellow/crimson) representing large cumulative liquidation leverage. When price sweeps through these clusters and open interest drops sharply without further downside continuation, it signals seller exhaustion.
What are perpetual futures open interest wipeout levels?
Wipeout levels represent price zones where significant portions of open interest (OI) are liquidated. A reduction of 15% to 25% in total contract open interest indicates market leverage has been thoroughly cleansed.
What is the liquidation cascade threshold between Binance and Bybit?
Binance and Bybit account for ~78% of all liquidations. When liquidation volume across both venues exceeds $150 million within a single 15-minute candle, it crosses the threshold of an unconstrained cascade.
Why do funding rates spike negative during a liquidation flush?
During a cascade, panicked traders aggressively open market short positions or buy downside put protection, driving perpetual contract prices below the spot price. This forces the 8-hour funding rate deeply into negative territory.
Risk Disclaimer
Trading and investing in digital assets, financial instruments, and predictive events involve substantial risk of loss and are not suitable for every investor. The predictive intelligence, probability distributions, historical precedents, and scenario modeling presented on this page are compiled for informational and research purposes only and do not constitute financial, investment, legal, or tax advice. Past performance and statistical precedents do not guarantee future outcomes. Always conduct independent due diligence before committing capital.