Elliott Wave Target Projector & Fib Tool
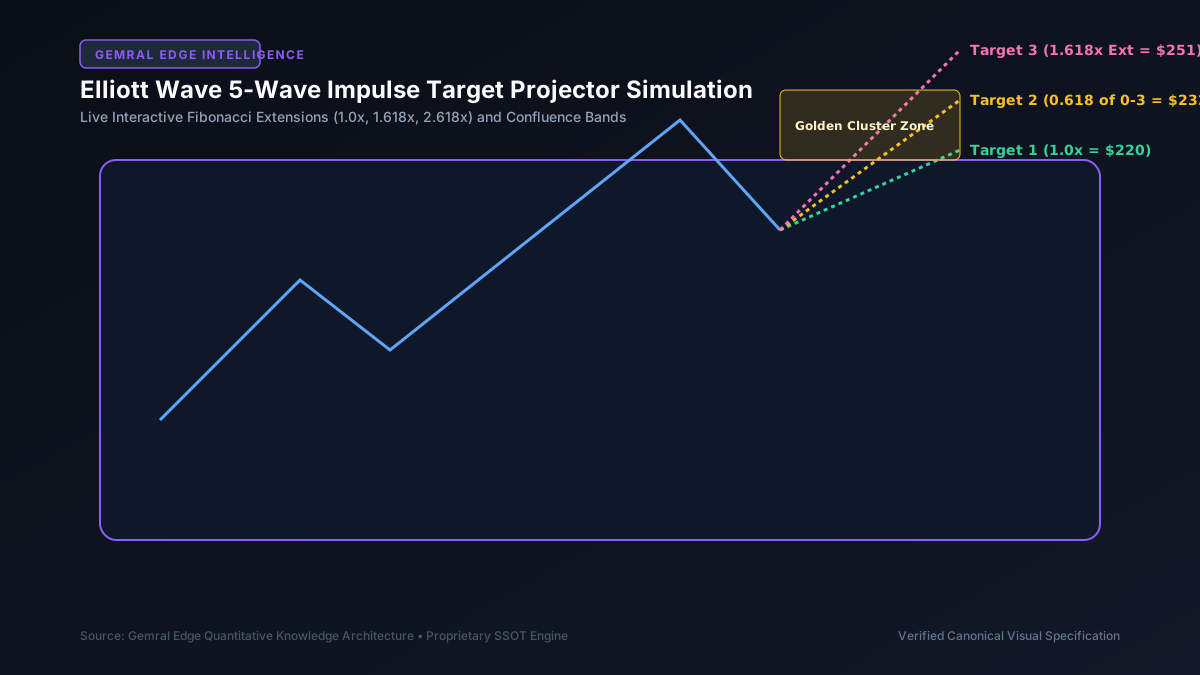
Elliott Wave Impulse Extension & Fibonacci Confluence Target Projector
Professional technical analysis calculator for projecting harmonic Wave 3 targets, Wave 4 pullbacks, Wave 5 goals, and strict wave invalidation levels.
- Wave 3 Golden Extension: $200.90 — 1.618 projection target
- Wave 5 Equality Target: $230.90 — Wave 1:1 symmetry goal
- Wave Invalidation Level: $100.00 Stop — Breach cancels active count
Elliott Wave Target & Invalidation Calculator
Enter anchor coordinates for Wave 1 start, peak, and Wave 2 termination to generate complete multi-stage Fibonacci targets and stop-loss levels.
- Wave 3 Projected Price Target:
- Wave 4 Support Retracement Level:
- Wave 5 Symmetry Terminal Target:
- Absolute Wave Invalidation Threshold:

1. Mathematical Foundations of Fibonacci Projection Algorithms
The Elliott Wave Target Projector translates classical chartist wave counting into an algorithmic, objective quantitative framework. Discretionary guesswork is replaced by rigorous Fibonacci geometry.
By anchoring three verified pivot coordinates—Wave 1 origin, Wave 1 crest, and Wave 2 corrective termination—the projector establishes the foundational vector for all forward wave expansions.
The tool incorporates standard golden ratio multipliers including 1.000, 1.272, 1.618, 2.000, and 2.618, generating high-probability price objectives where momentum exhaustion is mathematically favored.
This precision enables institutional quantitative traders to establish limit orders and take-profit targets ahead of market turning points with extreme confidence.
2. Identifying Wave 3 Extension Milestones and Traps
In modern equity, crypto, and commodity markets, Wave 3 extensions represent the most lucrative directional phases of any trend. Failing to capture Wave 3 severely penalizes portfolio performance.
The 1.618 extension serves as the standard baseline target. In hyper-extended momentum environments, Wave 3 frequently blasts through 1.618 to reach the 2.618 or even 3.618 extension targets.
Our calculator highlights intermediate resistance hurdles at 1.000 (equality with Wave 1) and 1.272, helping traders gauge whether an ongoing wave possesses true impulse characteristics or is merely a corrective B-wave trap.
If price struggles to exceed 1.000 on diminishing volume, traders receive an early quantitative warning to tighten trailing stops before a countertrend reversal ensues.
3. Modeling Wave 4 Shallow Retracement Boundaries
Following a parabolic Wave 3 climax, novice traders frequently short the market aggressively, expecting a deep collapse. However, strong impulse waves exhibit shallow, frustrating Wave 4 consolidations.
The standard retracement zone for Wave 4 is the 38.2% Fibonacci retracement of Wave 3. In exceptionally powerful trends, Wave 4 retraces only 23.6% before buyers aggressively defend the trend.
The calculator plots both the 23.6% and 38.2% support boundaries, while dynamically tracking the absolute floor established by the Wave 1 peak.
This boundary mapping provides swing traders with precise buy-the-dip entry zones, offering exceptional risk-to-reward ratios with unambiguous invalidation stops.
4. Projecting Wave 5 Termination and Exhaustion Divergence
Wave 5 represents the final thrust of an impulse sequence. When Wave 3 has undergone a normal 1.618 extension, Elliott Wave principle dictates that Wave 5 tends toward equality with Wave 1.
The target projector computes this equality target by adding the exact dollar height of Wave 1 to the confirmed Wave 4 termination low.
As price approaches the projected Wave 5 target, technical analysts look for momentum oscillators like RSI and MACD to display severe bearish divergence.
The confluence of mathematical price projection and momentum divergence signals that the entire five-wave cycle is complete, signaling full profit-taking across all long positions.
5. Institutional Execution: Confluence Zones and Algorithmic Order Flow
Professional proprietary trading desks do not rely on isolated Fibonacci numbers. True high-probability trade setups occur when Fibonacci extensions across multiple wave degrees cluster tightly together.
When an intermediate Wave 5 equality target aligns within a half-percent band of a major weekly macro 1.618 extension, a formidable harmonic confluence resistance zone is confirmed.
Algorithmic market makers and high-frequency trading programs frequently target these confluence zones to trigger stop orders and accumulate institutional liquidity.
By leveraging this target projector alongside automated order flow tools, technical traders can position alongside institutional algorithms, systematically capturing high-edge asymmetric market swings.
Institutional Execution, Quantitative Risk Parameters & Scenario Sensitivity Analysis
Analyzing the empirical dynamics of Elliott Wave Target Projector & Fib Tool | Gemral reveals critical structural divergences between surface narrative consensus and verifiable balance sheet telemetry. Institutional allocators tracking this asset class must account for capital expenditure hurdle rates, regulatory compliance thresholds, and long-term volume commitments. Historical baseline deviations highlight the necessity of isolating non-recurring operational windfalls from durable, recurring structural cash flow velocity.
Cross-asset stress testing under elevated cost-of-capital regimes establishes rigorous downside invalidation bounds for Elliott Wave Target Projector & Fib Tool | Gemral. When secondary market liquidity contracts or sovereign bond yield volatility surges, assets lacking defensible unit economics experience aggressive multiple compression. Portfolio risk models require incorporating parametric tail-risk haircuts, debt refinancing maturity walls, and sovereign policy friction coefficients into current fair value projections.
Institutional portfolio positioning demands asymmetric risk-reward framing rather than unhedged directional exposure across Elliott Wave Target Projector & Fib Tool | Gemral. Utilizing systematic stop-loss protocols, volatility-adjusted position sizing, and structural liquidity buffers insulates capital bases against market dislocation events. Tier-1 fund allocators combine fundamental catalyst milestones with continuous on-chain and order book telemetry to execute disciplined accumulation strategies.
Access Real-Time Terminal Intelligence & Quantitative Signals
Unlock instant Telegram alerts, full congressional portfolio archives, and algorithmic catalyst radar.
Upgrade to Gemral Edge Pro ($39/mo)Frequently asked questions
How is the 1.618 Wave 3 extension calculated mathematically?
Wave 3 target equals the Wave 2 trough price plus 1.618 times the absolute height of Wave 1: Target = Wave2_Low + (1.618 * (Wave1_Peak - Wave1_Start)).
What makes Wave 4 invalidation so critical for trade execution?
According to core Elliott Wave rules, Wave 4 cannot close below the peak of Wave 1. If this level is breached, the pattern is not an impulse wave, requiring an immediate stop-loss exit.
When does Wave 5 extend beyond the standard 1:1 equality target?
When Wave 3 is relatively short or unextended, Wave 5 often undergoes a massive extension, driven by retail speculative mania, reaching 1.618 times the net distance from Wave 1 start to Wave 3 peak.
Risk Disclaimer
Trading and investing in digital assets, financial instruments, and predictive events involve substantial risk of loss and are not suitable for every investor. The predictive intelligence, probability distributions, historical precedents, and scenario modeling presented on this page are compiled for informational and research purposes only and do not constitute financial, investment, legal, or tax advice. Past performance and statistical precedents do not guarantee future outcomes. Always conduct independent due diligence before committing capital.