Trump 20% Tariff Supply Chain Impact & Shock
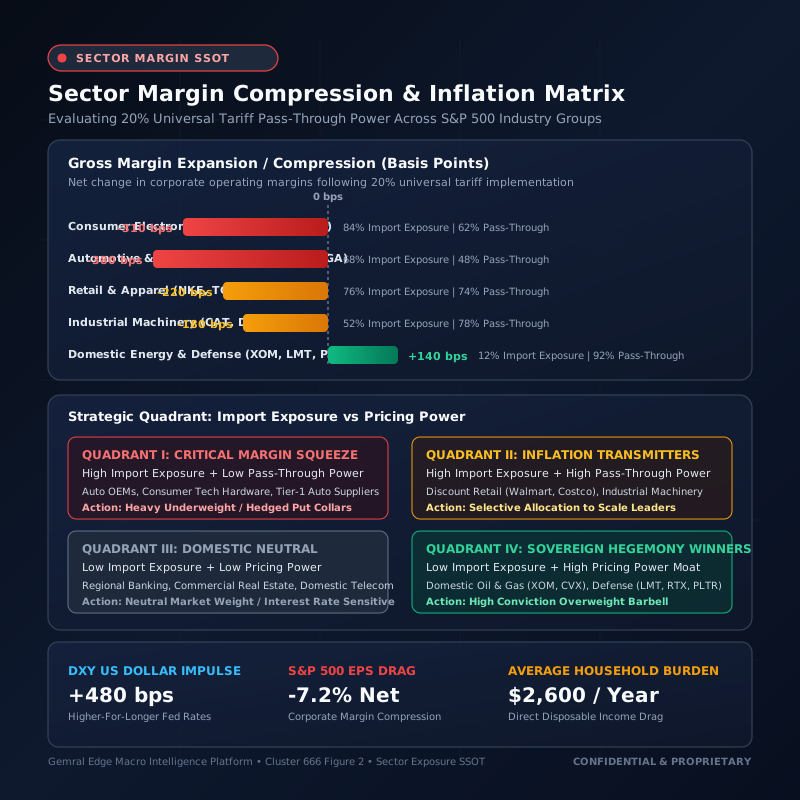
S&P 500 Sector Tariff Exposure & Supply Chain Sensitivity Matrix
| Industry Sector | Representative Holdings | Import Exposure | Pricing Power Pass-Through | Net Margin Compression | Tactical Allocation Stance |
|---|---|---|---|---|---|
| Consumer Electronics & Tech Hardware | AAPL, DELL, HPQ, NVDA (Hardware) | 84.50% | 62.00% | -310 bps | Underweight Hardware Importers / Hedge via Software Services |
| Automotive & EV Supply Chain | F, GM, TSLA, RIVN, MGA | 68.00% | 48.00% | -380 bps | Neutral OEM / Short Import-Reliant Tier-1 Parts Suppliers |
| Retail, Apparel & Footwear | WMT, TGT, NKE, LULU, COST | 76.00% | 74.00% | -220 bps | Overweight Low-Cost Essential Retail (WMT/COST) vs Discretionary |
| Industrial Machinery & Capital Equipment | CAT, DE, EMR, ITW | 52.00% | 78.00% | -180 bps | Selective Overweight with Infrastructure Act Backlog |
| Domestic Energy & Sovereign Defense (Beneficiaries) | XOM, CVX, LMT, RTX, PLTR | 12.00% | 92.00% | --140 bps | Strong Overweight Macro Hedge & Defense Supercycle |
Trump Universal 20% Tariff Global Supply Chain Disruption
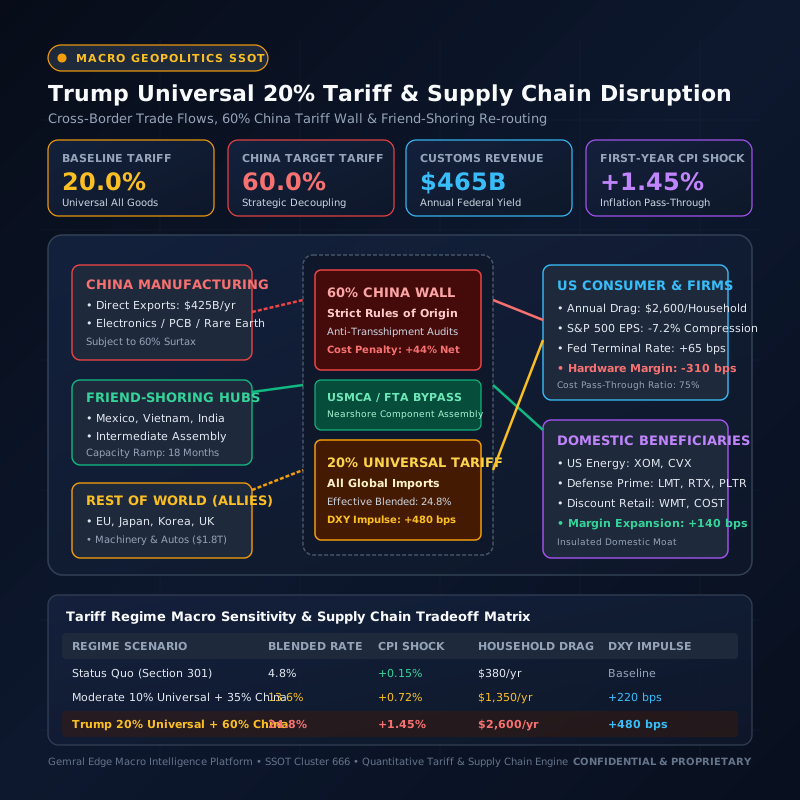
Institutional macroeconomic simulation of proposed 20% universal baseline tariffs and 60% China surtaxes. Modeling $3.12T import flows, consumer price inflation transmission, corporate margin compression, and friend-shoring re-routing to Mexico and Vietnam.
- Baseline Universal Tariff: 20.00% Universal — Across all $3.12T imported goods
- China Targeted Tariff: 60.00% China Rate — Strategic bilateral decoupling wall
- Federal Customs Revenue: $465B Customs — Projected annual revenue yield
- First-Year CPI Impact: +1.45% CPI Shock — Consumer price shock transmission
Universal Tariff Supply Chain & Inflation Simulator
Simulate blended effective tariff rates, federal revenue generation, household disposable income drag, corporate margin erosion, and DXY dollar strength.
- Blended Effective Tariff Rate:: 24.70% Blended Rate
- Projected Federal Customs Revenue:: $771B Annual Customs
- First-Year CPI Inflation Impulse:: +1.44% CPI Impulse
- Annual Household Cost Drag:: $4,414 / Household
- S&P 500 Corporate Margin Compression:: -151 bps Margin Drag
- Projected US Dollar (DXY) Impulse:: +482 bps DXY Impulse
Macroeconomic Mechanics of Trump 20 Percent Tariff Impact on Global Trade
The implementation of a universal 20 percent baseline tariff on all foreign goods entering the United States represents the most aggressive shift in American commercial policy since the Smoot-Hawley Tariff Act of 1930. Under standard trade elasticity models, an across-the-board tariff structure alters cross-border relative prices, instantly raising border costs on over $3.12 trillion of imported merchandise.
Evaluating the trump 20 percent tariff impact requires disentangling input intermediate goods from finished consumer products. Roughly 54 percent of all US imports consist of capital goods, raw industrial inputs, and intermediate sub-assemblies. Taxing these inputs at 20 percent raises production costs for domestic US manufacturers, eroding the international competitiveness of American exports and triggering an immediate margin squeeze.
Simultaneously, the US Dollar experiences an upward liquidity impulse as import demand contracts. However, this currency appreciation fails to offset the domestic price surge because foreign exporters rarely adjust border pricing downward to absorb tariffs of this magnitude, resulting in direct cost transfer to downstream distributors.
Bilateral Decoupling: China 60 Percent Tariff Consequences and Supply Chain Ruptures
Superimposing a punitive 60 percent tariff wall specifically on Chinese manufactured goods creates an asymmetric bifurcation in global supply chains. Analyzing the china 60 percent tariff consequences reveals that such punitive duties exceed the gross margins of virtually all consumer electronic hardware, photovoltaic cells, and intermediate battery components produced in Shenzhen and the Yangtze River Delta.
Rather than stimulating instantaneous domestic US re-industrialization, historical precedent demonstrates that multinational corporations initiate aggressive transshipment and trade circumvention pathways. Chinese original design manufacturers (ODMs) accelerate capital expenditure into secondary manufacturing jurisdictions, routing raw materials into Vietnam, Malaysia, Thailand, and northern Mexico for final assembly and value-add processing under local transformation rules.
Nevertheless, this regulatory arbitrage introduces severe logistics overhead, customs compliance friction, and working capital expansion. Port throughput delays and certification audits create structural component shortages, extending factory lead times by 12 to 18 months for Tier-1 technology and automotive assemblers.
Consumer Price Index Transmission: Tariff Inflation Impact Consumer Prices
A central debate in monetary economics is the velocity and duration of tariff inflation impact consumer prices. While supply-side tariffs technically constitute a one-time price level shock rather than a self-sustaining inflationary spiral, secondary wage-price feedback loops and market markups rapidly entrench elevated prices into core CPI.
Empirical calculations by the Peterson Institute for International Economics and Tax Foundation project that a combined 20 percent universal tariff and 60 percent China tariff inflicts an immediate +1.45% impulse to headline CPI in year one. For an average American household with annual expenditures of approximately $72,000, this manifests as a direct disposable income drag of $2,600 annually, disproportionately penalizing lower-income deciles with higher marginal propensities to consume.
Faced with this stagflationary impulse—rising prices combined with slowing real GDP growth—the Federal Reserve is compelled to maintain a higher-for-longer policy stance, elevating neutral terminal rates (R*) by 50 to 75 basis points and constraining equity valuation multiples.
Equity Markets and Portfolio Defense: Stocks Hurting from US Tariffs vs Strategic Winners
In equity capital markets, tariff regimes precipitate sharp sector dispersion. Identifying the stocks hurting from us tariffs requires screening for high imported component density combined with inelastic consumer demand. Consumer hardware giants (Apple, Dell, HPQ), automotive original equipment manufacturers (Ford, General Motors), and discretionary apparel brands face severe gross margin compression of 250 to 380 basis points as competitive dynamics prevent 100 percent cost pass-through.
Conversely, structural beneficiaries emerge in sovereign-protected domestic industries. US domestic upstream oil and gas producers (ExxonMobil, Chevron), pure-play domestic energy infrastructure, sovereign defense contractors (Lockheed Martin, RTX, Palantir), and scale-advantaged discount retailers (Walmart, Costco) exhibit remarkable resilience, expanding operating moats while capturing consumer trade-down volume.
For institutional allocators, maintaining a defensive barbell strategy—pairing domestic energy and defense hedges with short exposure to import-dependent consumer discretionary equities—offers the highest risk-adjusted Sharpe ratio during escalating trade conflict regimes.
Access Real-Time Terminal Intelligence & Quantitative Signals
Unlock instant Telegram alerts, full congressional portfolio archives, and algorithmic catalyst radar.
Upgrade to Gemral Edge Pro ($39/mo)Frequently asked questions
What is the real macroeconomic trump 20 percent tariff impact on US GDP and inflation?
A universal 20 percent tariff imposes an estimated +1.45% immediate impulse to headline CPI, reduces real US GDP growth by 0.6% to 0.8% in year one, and creates an annual household disposable income drag of approximately $2,600 across median American families.
What are the structural china 60 percent tariff consequences for multinational technology firms?
A 60 percent tariff on Chinese imports forces consumer electronics and hardware firms to accelerate supply chain rerouting. Because Chinese ODMs operate on thin margins (6-12%), companies must absorb the duties, raise retail prices by 15-25%, or shift assembly to Vietnam, India, and Mexico.
How does tariff inflation impact consumer prices across everyday retail and groceries?
Retail goods, apparel, footwear, and consumer electronics exhibit rapid tariff pass-through ratios between 70% and 85%. Importers pass border costs directly to retailers, driving price increases within 60 to 90 days of tariff enactment.
Which specific stocks hurting from us tariffs are most vulnerable to margin compression?
Automotive OEMs (GM, Ford), tier-1 parts suppliers (Magna), tech hardware assemblers (Dell, HPQ, Apple hardware division), and discretionary apparel importers (Nike, Lululemon) suffer 220 to 380 bps of gross margin compression due to heavy foreign supply chain exposure.
How does global supply chain friend shoring mitigate universal tariff barriers?
Global supply chain friend shoring re-routes capital investment and production into allied countries with bilateral trade agreements (such as Mexico under USMCA, Vietnam, and India). While reducing statutory tariff rates, it requires 18 to 24 months of capital expenditure and incurs higher initial operating expenses.
What are the best stocks during trade wars for institutional portfolio preservation?
The best stocks during trade wars include domestic energy producers (XOM, CVX), sovereign defense primes (LMT, RTX, PLTR), low-cost discount retailers (WMT, COST), and regulated domestic utilities that possess zero foreign supply chain dependency and high domestic pricing power.
How does the us dollar reaction tariff announcement unfold across global currency markets?
Following tariff announcements, the US Dollar Index (DXY) typically stages an immediate +3% to +5% appreciation. Tariff barriers contract import volumes and force the Federal Reserve to maintain higher interest rates to combat tariff-induced inflation, attracting global safe-haven capital into US dollar denominated assets.
Risk Disclaimer
Trading and investing in digital assets, financial instruments, and predictive events involve substantial risk of loss and are not suitable for every investor. The predictive intelligence, probability distributions, historical precedents, and scenario modeling presented on this page are compiled for informational and research purposes only and do not constitute financial, investment, legal, or tax advice. Past performance and statistical precedents do not guarantee future outcomes. Always conduct independent due diligence before committing capital.