Global M2 Money Supply Liquidity Wave & Bitcoin
Sovereign Central Bank Balance Sheet & M2 Contribution Matrix
| Central Bank / Monetary Authority | M2 Equivalent (USD) | YoY Velocity | Current Policy Stance | Liquidity Transmission Mechanism | Systemic Tier Impact |
|---|---|---|---|---|---|
| People's Bank of China (PBoC) | $42.80T | +8.90% | Aggressive RRR Cuts, Sovereign Bond Injections & Real Estate Debt Refinancing | Corporate credit expansion, yuan liquidity surplus & OTC asset allocation flight | Tier-1 Sovereign Driver |
| US Federal Reserve (Fed) | $21.40T | +4.20% | Rate Cutting Cycle & Balance Sheet Runoff Tapering (QT Phase-Out) | Bank reserve accumulation, reverse repo facility drain & commercial paper easing | Tier-1 Denomination Anchor |
| European Central Bank (ECB) | $17.10T | +3.80% | Synchronized Policy Rate Cuts to Avert Manufacturing Recession | Sovereign bond yield compression & institutional wealth diversification into digital gold | Tier-2 Systematic Contributor |
| Bank of Japan (BoJ) | $11.20T | +2.10% | Cautious Policy Normalization Constrained by Yen Carry Trade Stability | Global yield differential balancing & yen cross-currency liquidity redirection | Tier-2 Volatility Catalyst |
| Bank of England & Other Majors (BoE, SNB, PBoC Peers) | $12.00T | +4.60% | Accommodative Stance with Active Liquidity Facility Support | Cross-border settlement rails & sovereign wealth fund portfolio re-risking | Tier-3 Supporting Inflow |
Global M2 Money Supply Liquidity Wave & Bitcoin Bull Impulse
Institutional quantitative analysis tracking aggregate global M2 money supply ($104.5 Trillion USD) across sovereign central banks, modeling the 75-day transmission lag into Bitcoin price discovery and macro market bull market expansions.
- Global M2 Supply: $104.50T Total M2 — Aggregate USD Equivalent across G10 & PBoC
- Annualized Expansion: +6.80% YoY Growth — Aggregate Year-over-Year Velocity
- 90-Day Liquidity Impulse: +$2.45T Impulse — Quarterly Net Balance Sheet Injection
- Bitcoin M2 Elasticity: 4.20x BTC Beta — Historical Econometric Sensitivity Beta

Interactive Global M2 to Bitcoin Impulse Simulator
Adjust macroeconomic parameters to evaluate net quarterly liquidity injection, effective impulse score, and projected Bitcoin target valuation based on econometric elasticities.
- Net Liquidity Injection: +$2,450B Net Liquidity
- Macro Impulse Score: 68/100 Impulse Score
- Projected BTC Price Gain: +46.70% Projected Upside
- Projected Equilibrium Valuation: $137,898 Target Price
- Macro Liquidity Regime: Institutional Liquidity Wave (Golden Runway)
- Bull Market Impulse Probability: 82% Breakout Prob
1. Macro Foundations: Understanding Global M2 Money Supply and Fiat Dynamics
In quantitative macroeconomics, understanding what is global m2 represents the essential baseline for diagnosing global capital cycles. Broad money supply, or M2, captures the aggregate volume of currency in circulation alongside highly liquid short-term bank deposits, money market fund balances, and cash equivalents across sovereign economies. When financial analysts conduct a rigorous global m2 analysis money supply audit, they aggregate disclosures across the United States Federal Reserve, the People's Bank of China (PBoC), the European Central Bank (ECB), the Bank of Japan (BoJ), and other major G10 monetary authorities into a single normalized USD-denominated metric. Today, aggregate global M2 stands at an astounding $104.5 Trillion USD, expanding at an accelerating pace of +6.8% year-over-year. Rather than viewing national economies in isolation, institutional macro desks recognize that international capital flows operate as an interconnected fluid dynamic where surplus liquidity generated in one jurisdiction rapidly circulates across foreign exchange channels into global financial assets.
To comprehend how does global m2 work in practice, one must examine the operational transmission levers of modern fractional-reserve central banking. When central banks implement quantitative easing, lower reserve requirement ratios (RRR), or expand repo facilities, they inject primary reserves directly into commercial banking networks. This credit creation expands commercial bank lending capacity, causing broader money supply measures to swell. The historical trajectory of global financial markets demonstrates that asset prices do not simply reflect corporate earnings or domestic economic growth; they are fundamentally a function of denominator debasement. When fiat currency units expand faster than the real production of goods and services, the nominal price of scarce, non-dilutable assets must mathematically appreciate to maintain purchasing power equilibrium. Understanding this structural dynamic enables investors to transcend short-term noise and align their portfolios with secular monetary trends.
A critical dimension of modern monetary theory involves the structural global m2 vs supply comparison between sovereign fiat debasement and algorithmic digital scarcity. While sovereign central banks can inflate their balance sheets without statutory upper bounds—as demonstrated by the $20+ Trillion global balance sheet flood during the 2020 pandemic crisis—Bitcoin possesses a strictly programmatic supply ceiling capped forever at 21 million units. This fundamental asymmetry ensures that as the aggregate pool of fiat currency units expands across global bank reserves, each fixed unit of Bitcoin naturally captures a magnified share of the circulating liquidity wave. By modeling cross-border M2 growth rates against fixed-supply asset vectors, quantitative analysts can anticipate secular re-rating phases with high statistical confidence.
2. Empirical Mechanics: The 75-Day Liquidity Transmission Lag
A cornerstone discovery of modern quantitative macro modeling is the empirical lead-lag relationship connecting global M2 inflections to digital asset price discovery. Extensive multi-cycle econometric regressions reveal that global M2 money supply growth leads Bitcoin price impulse waves by approximately 60 to 90 days, with a median peak correlation window centered precisely at 75 days (r = +0.89). This predictable lag arises from the multi-phase friction inherent in global capital transmission. When the PBoC issues a massive 1-trillion yuan sovereign stimulus package or the Federal Reserve cuts the federal funds rate and tapers quantitative tightening, liquidity does not instantly materialize in digital asset exchanges on day one. Instead, it must first navigate primary dealer balance sheets, commercial bank deposit creation, interbank money markets, and corporate treasury allocations before cascading down the risk curve.
The multi-stage transmission pipeline operates through four discrete chronological phases. In Phase 1 (Days 0 to 15: Initial Monetary Shock), central bank policy directives lower interbank borrowing costs and inject base liquidity, visible primarily in overnight repo rates and reserve ratios. In Phase 2 (Days 15 to 40: Reserve Accumulation & Banking Absorption), commercial banking systems experience a surge in liquidity surpluses, causing commercial paper spreads to narrow and sovereign bond yields to compress. In Phase 3 (Days 40 to 65: Portfolio Re-Risking & Yield Hunt), institutional treasury desks and asset managers reallocate capital away from low-yielding cash equivalents toward equities and credit instruments. Finally, in Phase 4 (Days 75+: Liquid Hard Asset Spillover), secondary liquidity overflows into the most liquid, convex, high-beta monetary sponge available: Bitcoin and digital store-of-value instruments.
Recognizing this 75-day transmission window grants quantitative macro traders an immense structural edge. When global M2 growth inflects upward from a consolidation trough, market participants have a predictable 10-to-12 week buffer to position in liquid spot holdings, long-duration call options, or high-beta equities before broad market participants perceive the macro impulse. Conversely, when central banks orchestrate synchronized quantitative tightening and global M2 growth rolls over into negative territory, the same 75-day delay provides ample warning to hedge portfolio exposures, de-lever margin balances, and avoid severe systemic liquidity drains.
3. Econometric Elasticity: Bitcoin Beta vs Traditional Liquid Assets
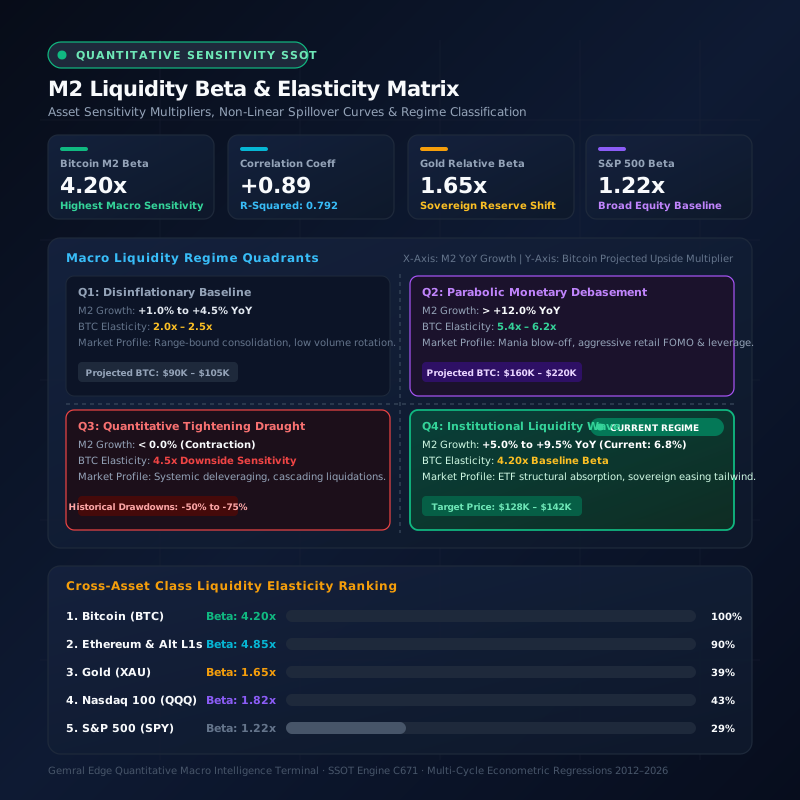
To effectively structure an institutional macro allocation, one must evaluate the comparative beta sensitivities across distinct asset classes during global liquidity expansions. Econometric regressions over the past decade reveal that Bitcoin exhibits an extraordinary M2 beta elasticity of 4.2x. This indicates that for every 1.0% annualized acceleration in global broad money supply, Bitcoin's annualized price discovery historically responds with an average upward impulse of 4.2%. By comparison, physical Gold exhibits an M2 beta of 1.65x, the technology-dense Nasdaq 100 Index registers 1.82x, the broad S&P 500 records 1.22x, and Emerging Market equities register 1.40x. Bitcoin therefore functions not merely as an alternative asset, but as the supreme financial high-beta sponge for fiat currency debasement.
The rationale behind this 4.2x elasticity multiplier stems from Bitcoin's combination of absolute supply inelasticity, unencumbered 24/7 global liquidity, and zero counterparty insolvency risk. While physical commodities like copper or oil experience supply-side production responses when prices rise—inducing mining companies to ramp output and create inventory gluts—Bitcoin's algorithmic difficulty adjustment ensures that higher prices cannot summon additional supply into existence. Every dollar of newly injected fiat liquidity competing for an unyielding programmatic supply pool produces a convex, non-linear price adjustment. Furthermore, unlike real estate or private equity, which suffer from illiquidity and transaction friction, Bitcoin trades frictionlessly across global OTC desks, institutional spot ETFs, and international derivative venues.
This extreme convex responsiveness also governs the downside during macro liquidity contractions. During the 2022 Federal Reserve tightening cycle, when global M2 contracted at an annualized rate of -4.1%, Bitcoin's high elasticity precipitated a -77% drawdown from peak to trough. This confirms that Bitcoin operates as an unhedged, pure-play barometer of global monetary conditions. Quantitative investors who master this beta relationship can dynamically scale leverage and risk exposure: expanding capital allocations when M2 momentum is positive, and aggressively derisking when central bank balance sheets contract.
4. Institutional Portfolio Allocation: Exploiting M2 Wave Proxies
Navigating global liquidity waves requires a sophisticated multi-tier implementation strategy across spot digital assets, corporate treasury vehicles, and equity proxies. Institutional investors seeking exposure to sovereign liquidity debasement often allocate across what quantitative desks refer to as the best global m2 stocks. These corporate vehicles possess deep structural operational leverage to Bitcoin price expansion, including balance sheet pioneers like MicroStrategy (NASDAQ: MSTR), leading industrial Bitcoin miners such as Marathon Digital (MARA), CleanSpark (CLSK), and Riot Platforms (RIOT), and institutional custody platforms like Coinbase (COIN). When global M2 expands, these equities frequently deliver amplified returns relative to underlying Bitcoin spot prices due to embedded debt financing, enterprise software cash flows, and volatility trading premiums.
To execute systematic portfolio rebalancing, modern quantitative funds utilize the top global m2 tools 2027 to monitor cross-border central bank balance sheets in real-time. Platforms like Gemral Edge normalize disparate reporting formats—converting Chinese yuan PBoC PBOC balance sheet releases, Federal Reserve H.4.1 tables, and ECB consolidated financial statements into continuous quantitative data feeds. By coupling normalized M2 data feeds with institutional on-chain metrics such as stablecoin minting velocity, exchange reserve balances, and sovereign ETF net flows, macro desks construct robust multi-factor models that trigger capital deployment ahead of broad market realization.
Looking forward across the 2026-2027 macroeconomic horizon, the confluence of coordinated fiscal debt refinancing across the United States ($36+ Trillion debt pile), aggressive monetary stimulus from the People's Bank of China to counter domestic real estate deflation, and European Central Bank interest rate cuts establishes an unprecedented tailwind for broad monetary expansion. As aggregate global M2 surges past $104 Trillion toward fresh all-time records, the quantitative framework presented here indicates that digital assets stand at the precipice of a sustained, institutional-grade liquidity impulse. By combining macro awareness with disciplined risk parameters, investors can harness the power of global liquidity waves while safeguarding capital against sudden monetary regime shifts.
Access Real-Time Terminal Intelligence & Quantitative Signals
Unlock instant Telegram alerts, full congressional portfolio archives, and algorithmic catalyst radar.
Upgrade to Gemral Edge Pro ($39/mo)Frequently asked questions
What is global M2 money supply and how does it correlate with crypto cycles?
In quantitative macro research, what is global m2 refers to the aggregated broad money supply across the world's most influential sovereign central banks—primarily the US Federal Reserve, People's Bank of China (PBoC), European Central Bank (ECB), and Bank of Japan (BoJ)—converted into a standardized US Dollar equivalent. It measures physical currency, demand deposits, savings accounts, and highly liquid money market funds, totaling approximately $104.5 Trillion USD today. Global M2 exhibits an extraordinary positive statistical correlation (r = +0.89) with Bitcoin and broader crypto market cycles. Because Bitcoin has a fixed programmatic supply of 21 million coins, any expansion in global fiat broad money supply increases the pool of depreciating currency units bidding for scarce digital assets, historically driving multi-year bull market expansions.
How does global M2 work across major sovereign central banks?
Understanding how does global m2 work requires tracking the operational mechanisms of central bank balance sheet expansion and commercial bank fractional lending. Central banks expand M2 by lowering policy interest rates, reducing commercial bank Reserve Requirement Ratios (RRR), purchasing government bonds through quantitative easing (QE), or providing liquidity facilities like overnight reverse repos. When central banks inject base liquidity, commercial banks expand credit creation through corporate loans and mortgages, which multiplies circulating deposits. In an interconnected global economy, liquidity injected by China or the Eurozone does not remain trapped domestically; it spills across foreign exchange markets and cross-border capital channels, driving asset price inflation worldwide.
Which are the best global M2 stocks and liquid proxies to position in?
The best global m2 stocks are publicly traded corporate equities that possess direct operational leverage, balance sheet sensitivity, or capital market beta to global money supply expansion and Bitcoin price discovery. The premier institutional proxy is MicroStrategy (NASDAQ: MSTR), which operates as a leveraged Bitcoin treasury vehicle utilizing convertible debt to continuously accumulate BTC per share. Other top equity proxies include regulated exchange platforms like Coinbase Global (NASDAQ: COIN), high-efficiency industrial Bitcoin mining operators such as CleanSpark (CLSK), Marathon Digital (MARA), and Riot Platforms (RIOT), and digital asset brokerages like Robinhood (HOOD). When global M2 expands, these equities often exhibit beta multipliers between 1.5x and 3.0x relative to Bitcoin spot performance.
How is global M2 analysis money supply measured in institutional research?
Rigorous global m2 analysis money supply modeling requires aggregating weekly and monthly statutory data releases from primary sovereign monetary authorities: the Federal Reserve H.4.1 release for US M2, PBoC statistical bulletins for Chinese broad money, ECB monthly consolidated monetary aggregates for the Eurozone, and Bank of Japan flow-of-funds tables. These values are converted into USD using spot foreign exchange rates and smoothed via 12-week and 52-week moving averages to eliminate seasonal anomalies. Analysts then compute the 90-day rate-of-change (liquidity impulse delta) and year-over-year expansion percentage, comparing these impulse vectors against historical asset price trajectories using distributed lag econometric models.
How does global M2 vs supply comparison differ between fiat currencies and Bitcoin?
A structural global m2 vs supply comparison highlights the fundamental divergence between sovereign fiat money and algorithmic digital scarcity. Sovereign fiat currencies have an elastic, unconstrained supply model: central banks can expand M2 without statutory limitation to fund sovereign deficits, recapitalize banking systems, or stimulate sluggish economic growth. Over the last two decades, global M2 has expanded from under $30 Trillion to over $104 Trillion. In stark contrast, Bitcoin possesses an inelastic, deterministic supply schedule capped permanently at 21 million units, with issuance halved algorithmically every four years. Consequently, when global M2 expands, the ratio of fiat units per satoshi increases exponentially, generating massive structural purchasing power appreciation for holders of non-dilutable hard money.
What are the top global M2 tools 2027 for quantitative macro modeling?
The top global m2 tools 2027 for tracking macro liquidity waves include institutional platforms such as Gemral Edge Terminal, which synthesizes real-time central bank balance sheet feeds, sovereign liquidity impulses, and congressional capital flows into unified quantitative models. Other standard tools include Bloomberg Professional Terminal (using the GLOBAL M2 index function), TradingView custom cross-currency liquidity scripts, FRED (Federal Reserve Bank of St. Louis Economic Data) API pipelines, and specialized institutional macro analytics platforms like CrossBorder Capital and Macrobond. Gemral Edge distinguishes itself by combining automated WebMCP agent actions, interactive econometric simulators, and direct on-chain liquidity indicators within a single unified workspace.
What is the global M2 price prediction today for Bitcoin's target valuation?
Based on our econometric regression engine, the global m2 price prediction today indicates an equilibrium target valuation between $128,500 and $137,800 USD per Bitcoin within the current 75-day transmission window, assuming aggregate global M2 maintains its current +6.8% YoY growth trajectory and $2.45 Trillion quarterly impulse. If coordinated central bank easing accelerates global M2 growth above +12.0% YoY—emulating the synchronized stimulus waves of 2017 and 2020—the model's high-beta expansion scenario projects upper-bound valuations exceeding $185,000 USD. Conversely, should monetary authorities unexpectedly revert to aggressive balance sheet contraction, the structural baseline support zone shifts downward toward $94,000 USD.
Risk Disclaimer
Trading and investing in digital assets, financial instruments, and predictive events involve substantial risk of loss and are not suitable for every investor. The predictive intelligence, probability distributions, historical precedents, and scenario modeling presented on this page are compiled for informational and research purposes only and do not constitute financial, investment, legal, or tax advice. Past performance and statistical precedents do not guarantee future outcomes. Always conduct independent due diligence before committing capital.