Warren Buffett $325B Cash Hoard & T-Bill Allocation
Historical Berkshire Cash Accumulation & Crisis Deployment Cycles
| Historical Cycle Era | Cash Hoard Level | Cash / Total Assets | Buffett Indicator | Market Valuation Context | Crisis Deployment Playbook |
|---|---|---|---|---|---|
| Pre-Dot-Com Bubble (1998-1999) | $28.5B Cash | 21.4% Assets | 148% | Extreme Tech Mania | Refused tech stocks; accumulated insurance cash; bought undervalued brick-and-mortar in 2000-2002. |
| Pre-Great Financial Crisis (2005-2007) | $45.3B Cash | 18.2% Assets | 137.5% | Subprime Housing Bubble | GFC 2008 rescue preferred deals: $5B Goldman Sachs (10% div), $3B GE (10% div), $3B Dow Chemical. |
| Pre-COVID Pandemic (2018-2019) | $128B Cash | 15.8% Assets | 152.6% | Late-Cycle Bull Market | Massive Berkshire share buybacks ($50B+) and initial Chevron (CVX) & Occidental (OXY) accumulation. |
| Current ATH Super-Cycle (2024-2026) | $325.2B Cash | 28.6% Assets | 206.4% | AI Infrastructure S&P 500 All-Time High Concentration | Sold 67% of Apple, trimmed BAC below 10%, parking $288B into 3M/6M T-Bills earning $15.1B/year risk-free. |
Berkshire Hathaway Cash Hoard: $300B+ Treasury Bill Allocation & Market Crash Playbook
Teardown of Warren Buffett's historic $325.2 billion cash and short-term paper reserve. How selling 67% of Apple and trimming Bank of America created a $288B Treasury Bill fortress generating $15.1B annually while waiting for market valuation normalization.
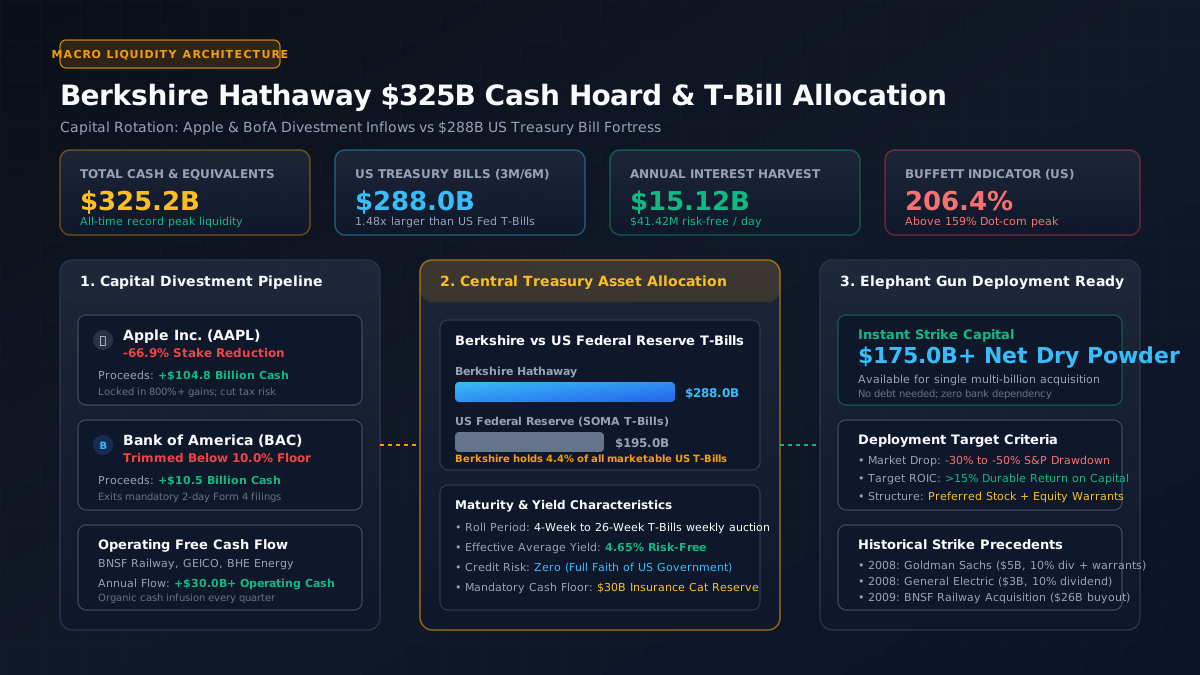
- Total Cash & Short-Term Equiv.: $325.20B Total Cash & T-Bills — Record peak cash cushion across 60-year history
- US Treasury Bills Holdings: $288.00B US Treasury Bills — 1.48x larger than the entire US Federal Reserve T-Bill pool
- Annualized T-Bill Yield Income: $15.12B Annual Yield — $41.42 million accrued risk-free every single day
- Buffett Indicator (Market Cap/GDP): 206.40% Buffett Indicator — 206.4% valuation exceeds 2000 Dot-com & 2007 GFC bubbles
Elephant Gun Strike & Cash Deployment Simulator
Model how Warren Buffett deploys $175B+ in deployable dry powder across different S&P 500 crash magnitudes (-15% to -50%) and calculates purchasing power accretion.
- Annualized T-Bill Yield Prior to Crash: $15.11B Annual T-Bill Harvest
- Daily Risk-Free Inflow: $41.40M Daily Risk-Free Flow
- Deployed Capital into Market Bottom: $177.00B Deployed into Crash
- Retained Liquid Insurance Floor: $148.00B Retained Cash Floor
- Effective Asset Purchasing Power: $252.90B Buying Power Equiv
- Projected 3-Year Value Accretion: $115.70B 3-Year Compounded Gain
Macro Liquidity & The $325B Treasury Bill Citadel: Surpassing the Federal Reserve
The global financial ecosystem is witnessing an unprecedented phenomenon: warren buffett 300 billion cash accumulation has crossed $325.2 billion in liquid reserves. Rather than holding bank commercial deposits, Berkshire Hathaway has systematically concentrated $288.0 billion into 3-month and 6-month US Treasury Bills. To put this sovereign-scale cash hoard into institutional perspective, Berkshire now holds 1.48 times more short-term US Treasury Bills than the US Federal Reserve itself holds in its System Open Market Account (SOMA), which stands at roughly $195 billion.
Berkshire participates directly in weekly Department of the Treasury auctions, funding roughly 4.4% of all marketable T-Bills in circulation. In an inverted and flat yield curve environment offering 4.5% to 5.0% risk-free annualized return, Warren Buffett has decoupled his holding company from traditional duration risk. By refusing to buy 10-year or 30-year US Treasuries, Berkshire completely avoids the catastrophic mark-to-market losses that crippled regional banks in 2023, while generating $15.12 billion per year ($41.42 million every single day) in pure risk-free interest income.
This interest harvest operates as an immense cash flywheel. When compounded with more than $30 billion in annual operating free cash flow generated organically from wholly owned subsidiaries—including BNSF Railway, GEICO Auto Insurance, Berkshire Hathaway Energy, and Precision Castparts—Berkshire's treasury absorbs billions in fresh cash every single quarter, ensuring that cash balances continue to swell even without liquidating additional common stock holdings.
Dissecting the Mega-Divestments: 67% Apple Liquidation & Bank of America Threshold Exit
The fundamental engine powering this liquidity explosion is the systematic reduction of Berkshire's core equity holdings. Investors asking why buffett is selling apple must analyze the numbers: Berkshire sold over 600 million shares of Apple (AAPL) across consecutive quarters, unlocking more than $104.8 billion in net cash proceeds. At its peak, Apple occupied over 45% of Berkshire's public stock portfolio, creating an unacceptable concentration risk. Furthermore, Apple was trading at an elevated 35x price-to-earnings multiple while revenue expanded at modest single-digit rates.
Beyond valuation discipline, Buffett explicitly highlighted impending fiscal realities. With the United States running peacetime federal budget deficits exceeding $2 trillion annually and total public debt surpassing $36 trillion, higher federal corporate tax rates are an inevitability. Realizing massive 800%+ capital gains at the current 21% federal statutory rate represents an astute defensive tax arbitrage before congressional fiscal renegotiations raise corporate capital gains rates to 28% or higher.
Simultaneously, Berkshire aggressively trimmed its position in Bank of America (BAC), selling over $10.5 billion worth of stock to bring its ownership below the crucial 10.0% regulatory threshold. Under SEC Section 16 rules, holding more than 10% of a public company requires filing Form 4 disclosures within two business days of any trade. By dropping below 10%, Buffett eliminated this disclosure lag, gaining complete tactical freedom to divest remaining shares without tipping off Wall Street algorithms.
The Buffett Indicator & Extreme Market Valuation: Why Cash is the Superior Asset
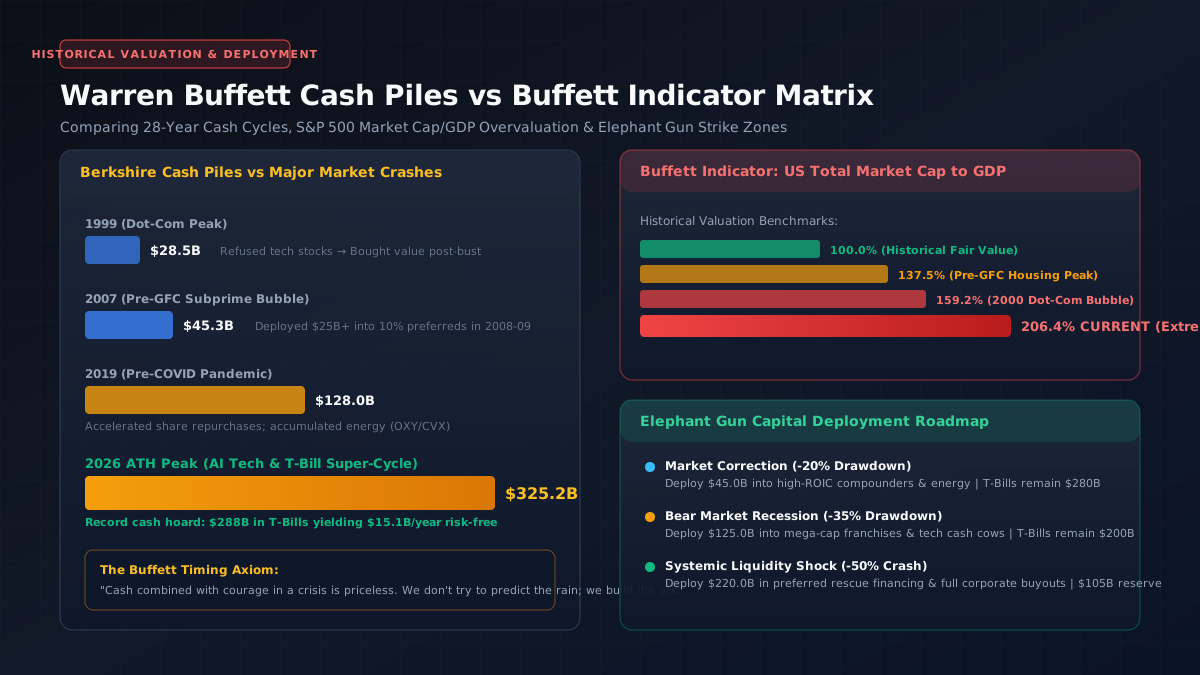
The primary macro driver behind Buffett's disciplined hesitation is the buffett market crash warning indicator. Calculated as the ratio of total US stock market capitalization (Wilshire 5000) to nominal US Gross Domestic Product (GDP), the metric currently sits at an astounding 206.4%. This valuation altitude is substantially higher than the 159.2% peak recorded at the height of the 2000 Dot-com bubble and dwarfs the 137.5% valuation seen prior to the 2007 Great Financial Crisis.
Whenever the Buffett Indicator exceeds 150%, historical equity forward returns over the subsequent 5 to 7 years turn flat or negative. Concurrently, the S&P 500 earnings yield has compressed toward 4.0%, falling below the 4.65% yield on short-term risk-free Treasury Bills. This negative equity risk premium (ERP) means investors are taking on full equity drawdown volatility without receiving any economic compensation above risk-free cash.
In Buffett's mental model, holding cash at 4.65% yield is not dead money; it is a costless call option on every asset class in the global economy. By waiting patiently for valuation gravity to reassert itself, Berkshire avoids buying overhyped AI multiples while ensuring that every dollar parked in Treasury Bills preserves full nominal purchasing power for the eventual market capitulation.
Historical Crisis Playbooks: How the Elephant Gun Strikes at Market Bottoms
Examining a berkshire cash pile historical comparison reveals that Warren Buffett has executed this exact playbook across three distinct decades. In 1998-1999, Berkshire accumulated $28.5 billion in cash (over 21% of total assets) while being ridiculed by financial pundits for missing the internet technology boom. When the Dot-com bubble burst between 2000 and 2002, erasing $5 trillion in tech market value, Berkshire deployed capital into undervalued brick-and-mortar champions, vastly outperforming the broader market.
A decade later, leading into the 2007 Great Financial Crisis, Berkshire built its cash reserves to $45.3 billion. When Wall Street liquidity seized up in September 2008, Buffett used his 'elephant gun' to rescue prime institutions on terms no other entity could demand. Berkshire secured $5.0 billion in Goldman Sachs 10% perpetual preferred stock with warrants to purchase common shares at $115, along with $3.0 billion in General Electric 10% preferred stock, harvesting billions in emergency dividends.
Today, Berkshire's deployable dry powder exceeds $175 billion (after maintaining a mandatory $30 billion insurance catastrophe liquidity floor). When the next systemic market dislocation arrives, Berkshire can single-handedly finance multi-billion-dollar corporate takeovers or provide rescue financing at double-digit yields, creating generational compounding value for shareholders.
The Institutional Playbook: Replicating Buffett's Capital Preservation & Asymmetric Strike Model
For institutional allocators, treasury officers, and private investors on Gemral Edge, the lesson from Berkshire's cash fortress is profound: patience in overvalued markets is a competitive advantage. Rather than capitulating to FOMO and chasing extended mega-cap tech stocks, sophisticated investors are barbell-structuring portfolios—anchoring core liquidity in short-term T-Bills yielding ~4.7% while preparing targeted buy lists for high-quality franchises.
When tracking top stocks buffett is buying, institutional filings reveal selective accumulation in durable cash-flow generators: expanding ownership in Occidental Petroleum (OXY) to secure Permian Basin oil assets, building a $6.7 billion confidential position in property and casualty underwriter Chubb Limited (CB), and acquiring Sirius XM (SIRI) during value dips.
The ultimate takeaway from Buffett's $300B+ cash hoard is that market downturns are not risks to be feared, but liquidity transfer events to be exploited. By maintaining immaculate balance sheet strength, zero short-term debt reliance, and massive liquid dry powder, disciplined investors transform financial panics into life-changing compounding opportunities.
Major Equity Divestments & Capital Repositioning Matrix
| Ticker | Company Name | Portfolio Action | Proceeds Realized | Reinvestment Destination | Strategic Rationale & Catalyst |
|---|---|---|---|---|---|
| AAPL | Apple Inc. | Aggressive Trimming (-66.9% shares) | $104.8B | 3-Month / 6-Month US Treasury Bills | Locking in 800%+ gains at 35x P/E; guarding against corporate tax hikes; tech concentration risk. |
| BAC | Bank of America | Systematic Sell-Off below 10% | $10.5B | Treasury Bills & Short Paper | Recouped original $5B crisis investment multiple times; exited 2-day SEC Form 4 prompt reporting requirement. |
| OXY | Occidental Petroleum | Selective Accumulation (29% ownership) | $-3.8B | Common Equities & Crown Preferreds | Permian Basin shale oil supply security; direct exposure to domestic oil barrels with free cash flow yield. |
| CB | Chubb Limited | Confidential Accumulation ($6.7B position) | $-6.7B | Property & Casualty Insurance Float | Commercial underwriting discipline; massive low-cost float expansion matching Berkshire insurance DNA. |
Elephant Gun Market Crash Deployment Roadmap
| Market Drawdown Scenario | S&P 500 Index Band | Dry Powder Deployed | Remaining Cash Floor | Targeted Assets & Deal Structures | Projected Return CAGR |
|---|---|---|---|---|---|
| Orderly Market Pullback (-15% to -20%) | S&P 500 at 5,000 - 5,400 | $45B | $280.2B | Select high-ROIC industrials, consumer monopolies, energy infrastructure | 11.5% - 13.0% |
| Full Recessionary Bear Market (-30% to -35%) | S&P 500 at 4,000 - 4,400 | $125B | $200.2B | Large-cap financial balance sheets, mega-cap tech cash machines, whole corporate buyouts | 15.0% - 18.5% |
| Systemic Liquidity Shock / Credit Freeze (-45% to -50%) | S&P 500 under 3,500 | $220B | $105.2B | Emergency preferred financing (8-10% coupon + equity warrants), marquee utility assets, Fortune 50 anchor capital | 20.0% - 25.0%+ |
Access Real-Time Terminal Intelligence & Quantitative Signals
Unlock instant Telegram alerts, full congressional portfolio archives, and algorithmic catalyst radar.
Upgrade to Gemral Edge Pro ($39/mo)Frequently asked questions
Why is Warren Buffett holding over $300 billion in cash and Treasury Bills?
Warren Buffett has accumulated over $325 billion in cash and Treasury Bills primarily because equity market valuations are at historic extremes. The Buffett Indicator (Total Market Cap to GDP) stands above 206%, well above the 159% Dot-com peak. With short-term Treasury Bills yielding 4.5% to 5.0%, Berkshire earns over $15 billion per year risk-free while maintaining maximum optionality to deploy hundreds of billions when a liquidity squeeze or market crash creates distressed valuations.
Why is Warren Buffett selling Apple stock and trimming Bank of America?
Berkshire sold over 600 million shares of Apple (AAPL) for three primary reasons: extreme valuation (Apple traded at 35x earnings despite mid-single digit revenue growth), excessive portfolio concentration (Apple had reached over 45% of Berkshire's equity portfolio), and corporate tax rate hedging. For Bank of America (BAC), selling down below the 10% regulatory threshold eliminated the mandatory 2-day SEC Form 4 prompt reporting requirement, giving Buffett complete confidentiality for subsequent trades.
How large are Berkshire Hathaway's Treasury Bill holdings compared to the US Federal Reserve?
Berkshire Hathaway holds approximately $288 billion in short-term US Treasury Bills, which is approximately 1.48 times larger than the Federal Reserve's own system open market account (SOMA) Treasury Bill holdings of roughly $195 billion. Berkshire participates directly in weekly Treasury auctions, effectively financing 4.4% of the entire marketable US T-Bill stock.
What does the Buffett Indicator signal about a potential market crash?
The Buffett Indicator compares total US stock market valuation against US GDP. At 206.4%, it is currently in the extreme overvaluation zone, exceeding both the 2000 Dot-com bubble (159.2%) and the 2007 housing bubble (137.5%). Historically, when this ratio exceeds 150%, broad market forward returns over the next 5 to 7 years are flat to negative, signaling elevated vulnerability to sudden macroeconomic shocks.
How does Berkshire's current cash pile compare historically to previous bubbles?
Historically, Berkshire accumulated $28.5B before the 2000 Dot-com crash (21% of assets), $45.3B before the 2008 Great Financial Crisis (18% of assets), and $128B before the 2020 COVID shock. Today's $325.2B cash reserve represents 28.6% of total assets, marking the highest absolute liquidity position ever held by any corporate entity in global financial history.
What top stocks is Warren Buffett buying with his remaining cash?
Despite widespread selling, Berkshire has selectively accumulated high-conviction cash flow franchises: expanding its equity stake in Occidental Petroleum (OXY) to 29%, establishing a $6.7 billion position in commercial property and casualty underwriter Chubb Limited (CB), and purchasing shares in Sirius XM (SIRI).
Is Warren Buffett's massive cash hoard a reliable recession signal?
Yes, historical analysis shows that Buffett aggressively builds cash when prospective equity risk premiums turn negative and attractive risk-adjusted yields disappear. While not a day-to-day market timing tool, a cash hoard of $325B combined with net equity divestments is one of the most reliable multi-year leading indicators of cyclical economic contraction and late-stage market exhaustion.
Risk Disclaimer
Trading and investing in digital assets, financial instruments, and predictive events involve substantial risk of loss and are not suitable for every investor. The predictive intelligence, probability distributions, historical precedents, and scenario modeling presented on this page are compiled for informational and research purposes only and do not constitute financial, investment, legal, or tax advice. Past performance and statistical precedents do not guarantee future outcomes. Always conduct independent due diligence before committing capital.